Archive

Monthly Archives: December 2013


As we come to the end of the year and the height of the holiday season, may all the best wishes be with you and yours.  As a global society, we need to communicate and come together to solve issues of the day.  Wouldn’t it be nice as we think about the blessings bestowed upon us and how lucky we are this holiday season, and that we think about how we can help our globe, the built environmental society, the natural community, the oceans and each other.  Happy Holidays and best wishes to all!!Image 

Image

Advertisement

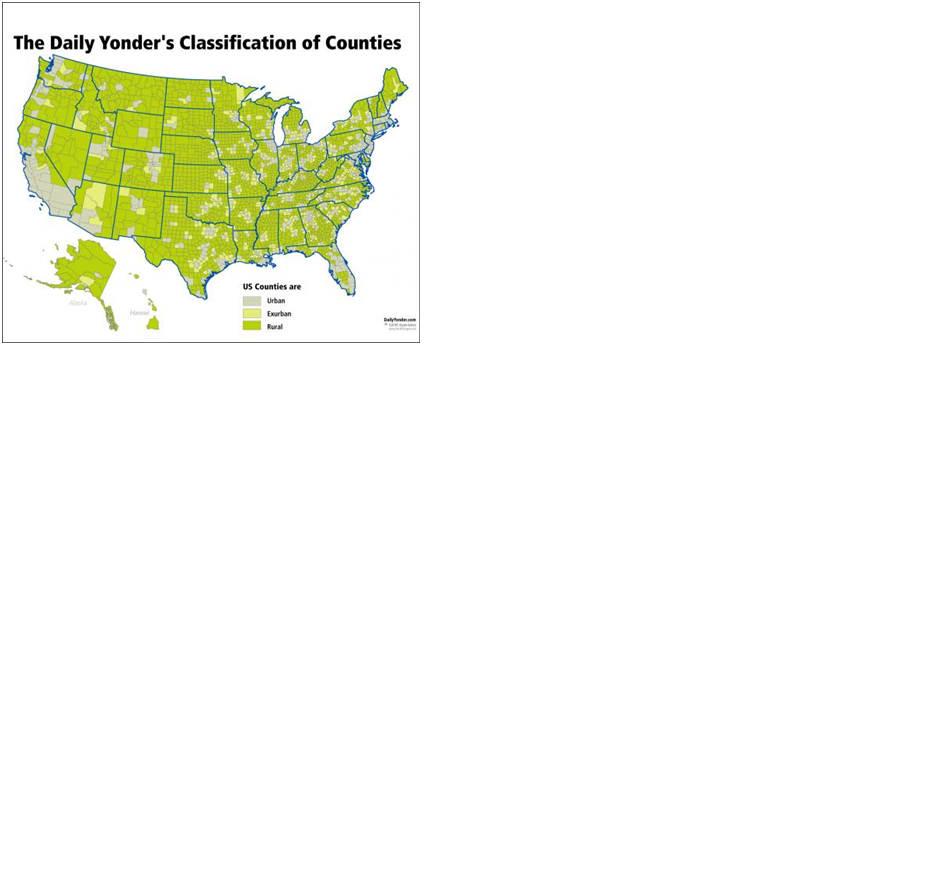
In the last blog I talked about the challenge to rural utilities, many of which serve relatively few people and have used federal monies to pay for a lot of their infrastructure.  In this blog we will take a look at the trends for community water systems which are defined as systems that serve at least 15 service connections or serve an average of at least 25 people for at least 60 days a year. EPA breaks the size of systems down as follows:

  • Very Small water systems serve 25-500 people
  • Small water systems serve 501-3,300 people
  • Medium water systems serve 3,301-10,000 people
  • Large water systems serve 10,001-100,000 people
  • Very Large water systems serve 100,001+ people

Now let’s take a look at the breakdown (from NRC 1997).  In 1960, there were about 19,000 community water utilities in the US according to a National Research Council report published in 1997.  80% of the US population was served.  in 1963 there were approximately 16,700 water systems serving communities with populations of fewer than 10,000; by 1993 this number had more than tripled—to 54,200 such systems. Approximately 1,000 new small community water systems are formed each year (EPA, 1995). In 2007 there were over 52,000 community water systems according to EPA, and by 2010 the number was 54,000.  85% of the population is served. So the growth is in those small systems with incidental increases in the total number of people served (although the full numbers are more significant). 


TABLE 1 – U.S. Community Water Systems: Size Distribution and Population Served


Number of Community Systems Serving This Size Community a

Total Number of U.S. Residents Served by Systems This Size b>

Population Served

1963

1993

1963

1993

Under 500

5,433 (28%)

35,598 (62%)

1,725,000 (1%)

5,534,000 (2%)

501-10,000

11,308 (59%)

18,573 (32%)

27,322,000 (18%)

44,579,000 (19%)

More than 10,000

2,495 (13%)

3,390 (6%)

121,555,000 (81%)

192,566,000 (79%)

Total

19,236

57,561

150,602,000

242,679,000

a Percentage indicates the fraction of total U.S. community water supply systems in this category.

b Percentage is relative to the total population served by community water systems, which is less than the size of the U.S. population as a whole.

SOURCES: EPA, 1994; Public Health Service, 1965.


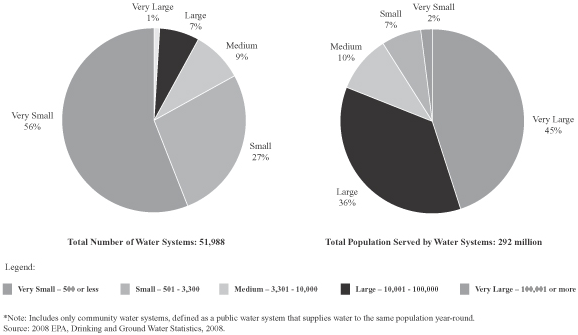
Updating these numbers, there are over 54,000 systems in the US, and growth is almost exclusively in the very small sector.  93% are considered to be small or very small systems—serving fewer than 10,000 people. Even though these small systems are numerous, they serve only a small fraction of the population. Very small systems, those that serve 3,300 people or fewer make up 84 percent of systems, yet serve 10 percent of the population.  Most critical is the 30,000 new very small systems that serve only 5 million people (averaging 170 per system).  In contrast, the very large systems currently serve 45% of the population.  Large plus very large make it 80%.  The 800 largest systems (1.6%) serve more than 56 percent of the population. 900 new systems were added, but large systems served an additional 90 million people.

What this information suggests if that the large and very large sector has the ability to raise funds to deal with infrastructure needs (as they have historically), but that there may be a significant issue for smaller, rural system that have grown up with federal funds over the past 50 years.  As these system start to come to the end of their useful life, rural customers are in for a significant rate shock. Pipeline average $100 per foot to install.  In and urban area with say, 60 ft lots, that is $3000/household.  In rural communities, the residents may be far more spread out.  As an example, a system I am familiar with in the Carolinas, a two mile loop served 100 houses.  That is a $1.05 million pipeline for 100 hours or $10,500 per house.  With dwindling federal funds, rural customers, who are already making 20% less than their urban counterparts, and who are used to very low rates, that generally do not account for replacement funding, will find major sticker shock. 

This large number of relatively small utilities may not have the operating expertise, financial and technological capability or economies of scale to provide services or raise capital to upgrade or maintain their infrastructure.  Keep in mind that small systems have less resources and less available expertise.  In contrast the record of large and very large utilities, EPA reports that 3.5 percent of all U.S. community water systems violated Safe Drinking Water Act microbiological standards one or more times between October 1992 and January 1995, and 1.3 percent violated chemical standards, according to data from the U.S. Environmental Protection Agency (EPA).. 

EPA and professionals have long argued that centralized infrastructure for water and sewer utilities makes sense form an economy of scale perspective.  Centralized drinking water supply infrastructure in the United States consists dams, wells, treatment plants, reservoirs, tanks, pumps and 2 million miles of pipe and appurtenances.   In total this infrastructure asset value is in the multi-trillion dollar range.  Likewise centralized sanitation infrastructure in the U.S. consists of 1.2 million miles of sewers and 22 million manholes, along with pump stations, treatment plants and disposal solutions in 16,024 systems.  It is difficult to build small reservoirs, dams, and treatment plants as they each cast far more per gallon to construct than larger systems.  Likewise operations, despite the allowance to have less on-site supervision, is far less per thousand gallons for large utilities when compared to small ones.  The following data shows that the economy-of-scale argument is true:

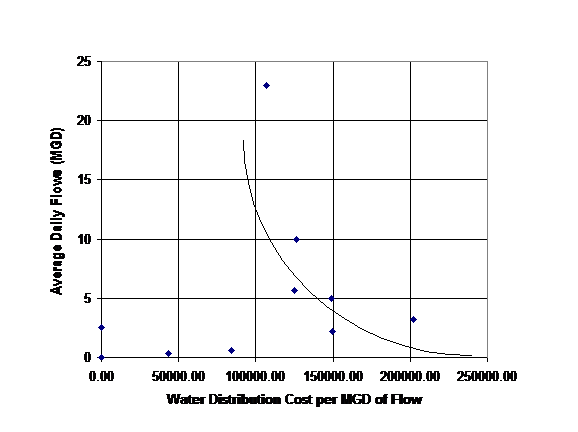
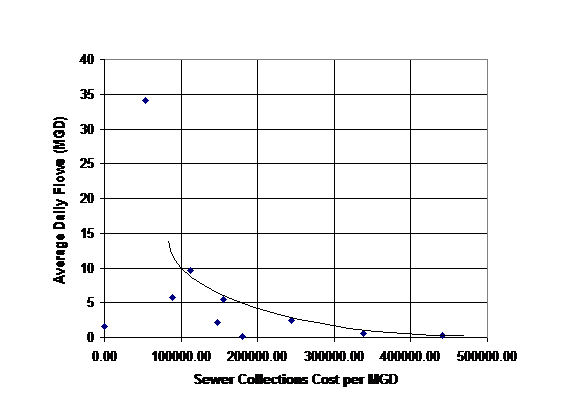
  • For water treatment, water distribution, sewer collection and wastewater treatment, the graphics clearly demonstrated the economy-of-scale of the larger utility operations versus small scale operations (see Figures 2-5). 
  • The administrative costs as a percentage of the.total budget parameter also demonstrated the economy-of-scale argument that larger utilities can perform tasks at a lesser cost per unit than the smaller utilities (see Figure 6).

Having reviewed the operations costs, the next step was to review the existing rates.  Given the economy-of-scale apparent in Figures 2 to 6, it was expected that there would be a tendency for smaller system to have higher rates.  Figures 2-6 demonstrate this phenomena. 

So what to do?  This is the challenge.  Rate hikes are the first issue, a tough sell in areas generally opposed to increases in taxes, rates and charges and who use voting to impose their desires.  Consolidation is anothe5r answer, but this is on contrast to the independent nature of many rural communities.  Onslow County, NC  figured out this was the only way to serve people efficiently 10 years ago, but it is a rougher sell in many, more rural communities.  Infrastructure banks might help, the question is who will create them and will the small system be able to afford to access them.  Commercial financing will be difficult because there is simply not enough income to offset the risk.  The key is to start planning now for the coming issue and realize that water is more valuable than your iPhone, internet, and cable tv.  In most cases we pay more for each of them than water (see Figure 7).  There is something wrong with that…

 Image


Figure 1  Breakdown of Size of Systems

Image


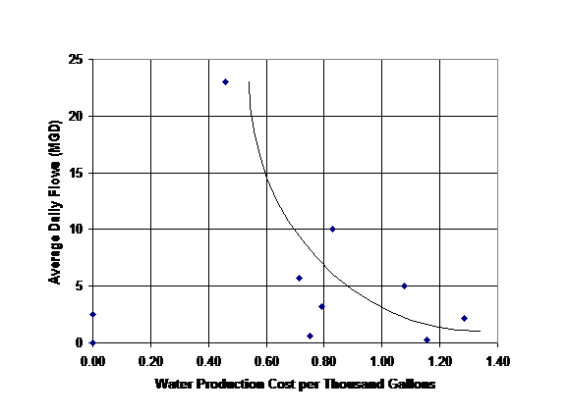
Fig 2 Cost of Water Treatment

Image


Fig 3 Cost of Water Distribution

Image


Fig 4 Cost of Sewer Collection

Image


Fig 5 Cost of Sewer Treatment

Image

Fig 6 Cost of Administration as a percent of total budget


Image

FIgure 7 Water vs other utilities


Several weeks ago we looked at the phenomenon of population, income, education and unemployment.  The impact to from the combination of these factors in certain communities can be difficult.  Let’s explore a little further as there is more, interesting data every day.  The US Department of Agriculture is releasing its report of rural America.  The findings are interesting and counter-intuitive to the understanding of voters in many of those communities.  Their findings include:

  • The rural areas grew 0.5 % vs 1.6% in urban areas from mid-2011-mid 2012
  • Rural incomes are 17% lower than urban incomes.
  • The highest income rural works (95th percentile) earn 27% less than their urban counterparts
  • 17.7% of rural constituents live in poverty vs 14.5% in urban areas
  • 80% of the high poverty rate counties were rural
  • All the high income counties are urban.

Wow!  So the ghetto has move to the country? According to these statistics there is truth in that statement.  Let’s look a little further using some on-line mapping. 

First let’s look at where these rural counties are.  Figure 1 is a map from www.dailyyonder.com  that shows (in green) the rural counties in the US.  Wikipaedia shows the 100 lowest income counties in Figure 2.  For the most part, these counties are rural, with the exceptions being a few areas in south Texas and in the Albuquerque/Santa Fe area of New Mexico. Raceonline.com shows the populations in poverty by county.  The red areas are the highest poverty rates.  The red areas in Figure 3 expand Figure 2 to include much of the rural deep south, Appalachia, more of Texas and New Mexico and part of the central valley in California.

Figure 4 shows how the number of young people has changed between 2000 and 2009 in rural counties (urban counties are white and not included – red means a decrease).  Figure 5 shows population growth (or not) by county. What you see in these two maps is that the young people are moving to the rocky mountain states and vacating the high poverty counties in Figure 3.  Yong people do not see jobs in the rural area – unemployment is 20% higher in rural America and the jobs that are there pay less.  Figures 6 and 7 show unemployment by County in 2008 after the start of the Great Recession and in 2013.  What these figures show is that with exception of the Plains states and Rockies, is that many of the areas with high poverty also had high unemployment, and that the unemployment has remains stubbornly high in many rural areas in the Deep South, Appalachia and New Mexico, plus high unemployment in parts to  the Great Lakes, but the poverty rates are still lower.  Education may by a factor in why the Plains states and Rocky Mountains have less unemployment – despite being rural their students are far more likely to graduate from high school than those in the deep South, Appalachia where unemployment remains high and incomes low. 

So what does this possibly have to do with utilities?  Utilities need to understand this problem as is demands some real, on-the-ground leadership.  Small and rural utilities are more costly to operate per thousand gallons than larger utilities.  A 1997 study by the author showed that economy-of-scale manifested itself to a great extent with water and wastewater operations.  The differences were not close – it is a lot less costly to operate large utilities vs small ones.  Rural utilities complicate the issue further because not only is the number of customers limited, but the pipe per customer is less so the capital investment per customer is far higher than in urban areas.  The impact is that utilities are under pressure to reduce rates to customers, or create a set of lower cost rates for those in poverty, while at the same time their costs are increasing and infrastructure demands are incrementally higher than their larger neighbors.  The scenario cannot be sustained, especially when large portions of rural infrastructure was installed with FHA grants, meaning the customers never paid for the capital cost in the first place.  There was no or lower debt, than what larger utility customers have.  The rural rates since these investments have been set artificially lower than they should as a result. But with Congress talking about reducing SRF and FHA programs, FHA is unlikely to step in to replace their initial investment, meaning that the billions of rural investment dollars that will be needed in the coming years will need to be locally derived, and rate shock will become a major source of controversy in areas that are largely very conservative politically and tend to vote against projects that will increase costs to them.

The good news is that much of the rural infrastructure may be newer when compared to much of the urban infrastructure.  So there is time to build the argument that local investment is needed.  The community needs to be engaged in this discussion sooner as opposed to when problems occur.  Saving for the infrastructure may be the best course since rural utilities will have limited access to the borrowing market because of their size, but that means raising rates now and keeping those saved funds as opposed to using them to deer rate increases.  If ongoing efforts in the House deplete federal funding further, the pinch will be felt sooner by rural customers who will lose the federal dollars from SRF and FHA programs. 


Image

Figures 1 – Rural Counties

http://www.dailyyonder.com/united-states-rural-urban-and-exurban-counties/2009/03/17/2002


Image


Figure 2.  100 lowest income Counties in the US


http://en.wikipedia.org/wiki/List_of_lowest-income_counties_in_the_United_States


Image

Figure 3.  Estimated population in poverty

http://www.raconline.org/racmaps/mapfiles/poverty.jpg


Image

Figure 4.  Where the Young People Are

http://www.raconline.org/maps/topic_details.php?topic=55


Image


Figure 5.  Where people are moving to http://www.raconline.org/maps

Image


Figure 6  Unemployment 2008

http://en.wikipedia.org/wiki/Unemployment

Image

Figure 7  Unemployment 2013 http://www.huduser.org/portal/pdredge/pdr_edge_featd_article_040


Local utilities are among the largest power users in their communities.  This is why power companies make agreements with utilities at reduced cost if the utilities will install backup power supplies.  The peak power generation capacity as well as backup capacity is at the local utilities and other large users.  Power companies can delegate this capital cost to large users without the investment concerns.  It works for both parties.  In addition, power companies spend effort to be more efficient with current power supplies, because recovering the costs for new, large plants is difficult, and in ways, cost prohibitive.  Hence small increment options are attractive, especially when they are within high demand areas (distributed power).  The use of localized wind, solar and on-site energy options like biogas are cost effective investments if sites can be found.  That is where the utilities come in.  Many utilities have sites.  Large water utilities may have large reservoirs and tank sites that might be conducive to wind or solar arrays.  Wind potential exists where there are thermal gradients or topography like mountains.  Plant sites with many buildings and impervious areas could also be candidates for solar arrays and mini-wind turbines.  Wastewater plants are gold mines for digester gas that is usually of high enough quantity to drive turbines directly.  So utilities offer potential to increase distributed power supplies, but many water/wastewater utilities lack the expertise to develop and maintain these new options, and the greatest benefit is really to power companies that may be willing to provide as much money in “rent” to the utilities as they can save.   Power entities obviously have the expertise and embedded experience to run distributed options optimally.  So why don’t we do this?

I would speculate several reasons.  First, the water/wastewater utilities have not really considered the option, and if they do there is the fear of having other folks on secure treatment sites.  That can be overcome.  The power entities have not really looked at this either.  The focus in the power industry is to move from oil-based fuels to natural gas to accumulate carbon credit futures, the potential for lower operating costs and better efficiency of current facilities to reduce the need for capital investments.  Power entities operate in a tight margin just like water/wastewater utilities do so saving where you can is a benefit.  There are limited dollars to invest on both sectors and political and/or public service commission issues to overcome to invest in distributed power options at water/wastewater facilities. 

But a longer-term view is needed.  While fossil fuels have worked for us for the last 100 years, the supply is finite.  We are finding that all that fracking might not give us 200 years, but more like 20-40 years of fuel.  We have not solved the vehicle fuel issue and fossil fuels appear to be the best solution for vehicles for the foreseeable future which means they will compete directly with power demands.  Natural gas can be used for vehicles fairly easily as evidenced by the many transit and local government fleets that have already converted to CNG. 

The long-term future demands a more sustainable green power solution.  We can get to full renewable power in the next 100 years, but the low hanging fruit need to be implemented early on so that the optimization of the equipment and figuring out the variables that impact efficiency can be better understood than they are now.  For example, Leadville, CO has a solar array, but the foot of snow that was on it last September didn’t allow it to work very well.  And solar arrays do use water to clean the panels.  Dirty panels are nowhere near as efficient as clean ones.  We need to understand these variables.

Area that are self sufficient with respect to power will benefit as the 21st century moves forward.  There are opportunities that have largely been ignored with respect to renewable power at water and wastewater facilities, and with wastewater plants there is a renewable fuel that is created constantly.  Wastewater plants are also perfect places to receive sludge, grease, septage, etc which increase the gas productions.  There are examples of this concept at work, but so far the effort is generally led by the wastewater utilities.  An example is East Bay Municipal Utility District (Oakland, CA) which produces 120% of its power needs at its wastewater plant, so sells the excess power back to the power company.  There are many large wastewater plants that use digester gas to create power on-site to heat digesters or operate equipment.  Others burn sludge in on-site incinerators to produce power.  But so far the utilities are only reducing their cost as opposed to increasing total renewable power supplies.  A project is needed to understand the dynamics further.  If you are interested, email me as I have several parties wishing to participate in such a venture. 


As 2014 is only a month away, expect water and sewer infrastructure to become a major issue in Congress.  While Congress has failed to pass budgets on-time for many years, already there are discussions about the fate of federal share of SRF funds.  The President has recommended reduction in SRF funds of $472 million, although there is discussion of an infrastructure fund, while the House has recommended a 70% cut to the SRF program.  Clearly the House sees infrastructure funding as either unimportant (unlikely) or a local issue (more likely).  Past budgets have allocated over $1.4 billion, while the states put up a 20% match to the federal share.  A large cut in federal funds will reverberate through to local utilities, because many small and medium size utilities depend on SRF programs because they lack access to the bond market.  In addition, a delay in the budget passage due to Congressional wrangling affects the timing of SRF funds for states and utilities, potentially delaying infrastructure investments. 

This decrease in funding comes at a time when ASCE rates water and wastewater system condition as a D+ and estimates over $3 trillion in infrastructure investment will be needed by 2020.  USEPA notes that the condition of water and wastewater systems have reached a rehabilitation and replacement stage and that infrastructure funding for water and sewer should be increased by over $500 billion per year versus a decrease of similar amounts or more.  Case Equipment and author Dan McNichol have created a program titled “Dire Straits:  the Drive to Revive America’s Ailing Infrastructure” to educate local officials and the public about the issue with deteriorating infrastructure.  Keep in mind much of what has made the US a major economic force in the middle 20th century is the same infrastructure we are using today. Clearly there is technical momentum to indicate there is greater need to invest in infrastructure while the politicians move the other way.  The public, caught in the middle, hears the two sides and prefers less to pay on their bills, so sides with the politicians as opposed to the data. 

Local utilities need to join the fray as their ability to continue to provide high quality service.  We need to educate our customers on the condition of infrastructure serving them.  For example, the water main in front of my house is a 50 year old asbestos concrete pipe that has broken twice in the past 18 months. The neighborhood has suffered 5 of these breaks in the past 2 months, and the City Commission has delayed replacement of these lines for the last three years fearing reprisals from the public.  Oh and the road in front of my house is caving in next to where the leak was.  But little “marketing” by the City has occurred to show the public the problem.  It is no surprise then that the public does not recognize the concern until service is interrupted.  So far no plans to reinitiate the replacement in front of my house.  The Commission is too worried about rates.

Water and sewer utilities have been run like a business in most local governments for years  They are set up as enterprise funds and people pay for what they use.  Just like the private sector.  Where the process breaks down is when the price is limited while needs and expenses rise.  Utilities are relatively fixed in their operating costs and I have yet to find a utility with a host of excess: workers.  They simply do not operate in this manner.  Utilities need to engage the public in the infrastructure condition discourse, show them the problems, identify the funding needs, and gain public support to operate as any enterprise would – cover your costs and insure you keep the equipment (and pipes) maintained, replacing them when they are worn out.  Public health and our local economies depend on our service. Keep in mind this may become critical quickly given the House commentary.  For years the federal and state governments have suggested future funding may not be forthcoming at some point and that all infrastructure funding should be local.  That will be a major increase in local budgets, so if we are to raise the funds, we need to solicit ratepayer support.  Now!  


In the field of engineering, the concept of sustainability refers to designing and managing to fully contribute to the objectives of society, now and in the future, while maintaining the ecological, environmental, and economic integrity of the system.  Most people would agree that structures such as buildings that have a lifespan measured in decades to centuries would have an important impact on sustainability, and as such, these buildings must be looked at as opportunities for building sustainably. When people think about green buildings, what generally comes to mind is solar panels, high efficiency lighting, green roofs, high performance windows, rainwater harvesting, and reduced water use.  This is true, but building green can be so much more.

The truth is that the built environment provides countless benefits to society; but it has a considerable impact on the natural environment and human health (EPA 2010). U.S. buildings are responsible for more carbon dioxide emissions annually than those of any other countries except China (USGBC 2011). In 2004, the total emissions from residential and commercial buildings were 2,236 million metric tons of carbon dioxide (CO2), more than any other sector including the transportation and industrial sectors (USGBC 2011). Buildings represent 38.9% of U.S. primary energy use,72% of U.S electricity consumption (and 10% worldwide), 13.6% of all potable water, and 38% of all CO2 emissions (USGBC 2011).  Most of these emissions come from the combustion of fossil fuels to provide heating, cooling, lighting, and to power appliances and electrical equipment (USGBC 2011). Since buildings have a lifespan of 50 to 100 years during which they continually consume energy and produce carbon dioxide emissions, if half of the new commercial buildings were built to use only 50 percent less energy, it would save over 6 million metric tons of CO2 annually for the life of the buildings. This is the equivalent of taking more than one million cars off the roads each year (USGBC 2011).

The United States Green Building Council (USGBC) expects that the overall green building market (both non-residential and residential) to exceed $100 billion by 2015 (McGraw Hill Construction 2009).  Despite the economic issues post 2008, it is expected that green building will support 7.9 million U.S. jobs and pump over $100 million/year into the American economy (Booz Allen Hamilton, 2009). Local and state governments have taken the lead with respect to green building, although the commercial sector is growing.

Green building or high performance building is the practice of creating structures using processes that are environmentally responsible and resource efficient throughout a building’s life cycle, from site to design, construction, operation, maintenance, renovation, and deconstruction (EPA 2010). High performance building standards expand and complement the conventional building designs to include factors related to: economy, utility, durability, sustainability, and comfort. At the same time, green building practices are designed to reduce the overall impact of the built environment on human health and use natural resources more responsibly by more efficiently using energy, water, and other resources, while protecting occupant health and improving employee productivity.

High Performance Buildings are defined by incorporating all major high performance attributes such as energy efficiency, durability, life-cycle performance, natural lighting, and occupant productivity (EPA 2010). High performance buildings are constructed from green building materials and reduce the carbon footprint that the building leaves on the environment. A LEED-certified green building uses 32% less electricity and saves around 30% of water use annually (USGBC 2011). Building owners know that there is a return on investment of up to 40% by constructing a green building as a result of savings to energy and water (NAU 2012).

The cost per square foot for buildings seeking LEED Certification falls into the existing range of costs for buildings not seeking LEED Certification (Langdon, 2007).  An upfront investment of 2% in green building design, on average, results in life cycle savings of 20% of the total construction costs – more than ten times the initial investment (Kats, 2003), while building sale prices for energy efficient buildings are as much as 10% higher per square foot than conventional buildings (Miller et al., 2007). At the same time, the most difficult barrier to green building that must be overcome includes real estate and construction professionals who still overestimate the costs of building green (World Business Council, 2008).

New data indicates that the initial construction cost of LEED Certified buildings can sometimes cost no more than traditional building practices.  A case study done by the USGBC showed that the average premium for a LEED certified silver building was around 1.9% per square foot more than a conventional building.  The premium for gold is 2.2% and 6.8% for platinum.  These numbers are averaged from all LEED-registered projects, so the data is limited, but demonstrates that in some cases it does not cost much extra to deliver a LEED certified project which greatly improves the value of the building and lowers operating costs (Kuban 2010).  The authors’ experience with the Dania Beach nanofiltration plant indicated the premium was under 3% to achieve LEED-Gold certification compared to standard construction.

So the question is, why don’t we see more green buildings?  We know water plants can be green (Dania Beach Nanofiltration Plant), but that was the first nanofiltration plant in the world to be certified Gold.  The SRF programs prioritize green infrastructure – so why do more people not pursue them?  It may be an education process.  Or maybe the market just has not caught up.  CIties and states are leading the way here.  Utilities may want to look at this as well.Image


Communicating effectively in both written form and public speaking is critical for the success of the utility.  I have been reading several books on leadership and communication remains an ongoing issue throughout.  We see many schools trying to incorporate this into the engineering curriculum, but that leaves far too many outside the training “program.”  The problem is that many people think they communicate well, when in fact they do not.  Nothing is  more of a reality check than college students, too many of which write in “text message form” as opposed to real written words.  Presenting utility concepts and ideas to different audiences is an integral part of the profession and unfortunately the technical nature of many of our issues requires technical people to communicate concepts to non-technical audiences.  This s far more difficult than it appears, which is part of why the message may be lost.  .Knowing this fact, aspiring utility employees must become familiar with using visual aids and computer-based tools to convey the important design details, so that, the client, regulators, politicians, the public and even other engineers can envision what the final product will look like and evaluate their ability to successfully execute the project. 

We tell our students that technical communication for civil engineers is essential to the profession and is a prerequisite for a successful engineering career. It assists in conveying information, serves as a thought process tool, and is arguably just as essential as excellent analytical or computational skills. For some, writing well comes naturally, for others, it can be a struggle. The difference can be experience, confidence, and proper planning. Planning makes writing easier. A good place to start would be to make an outline of topics to adequately cover the necessary content and in the appropriate order that allows the reader to follow along in a logical fashion. Of course too many of them resist outlines and read very little.  

Reading and writing go hand in hand.  If you read a lot, you have a better chance of being a good writer than those o do not.  The saving grace of the vampire books, Hunger Games, Game of thrones and 50 Shades series is that someone is actually reading the books. That is a first step.  Of course the news is another matter.  History, of course no so much.  For utility folks, it is technical materials that must be read, digested and conveyed to the ratepayers.  People are naturally suspicious of those they cannot understand, a huge barrier for the industry to overcome. I remind our students than when the general public is asked what engineers do, more than half answer:  drive trains.  Wow.  the disconnect!

It is important to avoid overly long documents with too much technical detail, jargon or specialized terms, distractions and tangents.The consequences of poor communications clearly justify the amount of time and effort required to write well because, for example, the written word in a document is permanent; therefore, the bad impression left with the reader of sloppy work can be extremely damaging.  We need to engage the public in a positive way.  Communication needs to be a more robust goal for all of us than it currently is to engender that needed support.

%d bloggers like this: