Archive

Monthly Archives: July 2016


My grandmother lost here summer cabin outside of Grayling, Michigan in the Great Crawford County fire on 1990.  My grandfather had hauled the cabin and out buildings up to Grayling by rail from Detroit in the 1920s (some old houses my Great Grandmother had owned).  It was one of many fires that year, but an early one caused by significantly less snow over the prior winter, high winds, and carelessness.   The cabin was gone before anyone could react as it appears to have been in the dead center of the moving flames.  I recall the story on CNN, but no one realized exactly where it was.  My grandmother never recovered.  She wasn’t the only one.  20 year later there are trees.

Forest fires happen with increasing frequency. Today in Southern California, the Sand Fire has set more than 35,000 acres of the Santa Clarita Valley ablaze.  Difficulties fighting it are not limited to temperatures hitting 101 degrees in the area and dried brush from 5 years of drought conditions.  The Soberanes Fire in Monterey County has burned 16,100 acres along the California coast between Carmel and Big Sur. The fire is bigger than the size of Manhattan.  The 778 acre McHugh Fire located on the steep terrain south of Anchorage, Alaska.  Looking at the map, it seems the west is on fire.  A larger and larger portion of the US Forest Services’ budget gets spent on fire-fighting each year – 67% in 2016.  Yet fires on Forest Service property account for only 20% of the total fire nationally (1.9 million acres or a total of over 10 million acres in 2015), but this total amount is increasing.  Warmer weather in the west has increased the length of fire season, drought has increased the risk, budgets are stagnant so means to prevent fire intensity have been reduced, The only good news is that a University of Vermont study suggests that areas where pine beetle has killed trees is actually thinner and less at risk that heathier forests, if that is a “good” thing.

My friend Dr. Chi Ho Sham did some work on forest fires on watersheds a few year back.  He found that forest fires have obvious impacts on people and our customers, but also our water supplies and our water supplies.  The ash runs off into streams and is difficult to remove at water plants because it is so fine.  Areas burned are far more subject to erosion after rain of snow melt thereby creating a need for more treatment at water plants.  This will go on for some time after the rain until groundcover can re-establish itself.  Fire retardant and water drops combat some fires although the retardant shows up in streams and water supplies with adverse impacts.  Dams and reservoirs will need more frequent dredging due to buildup, and wildlife equilibrium will be disrupted.  Forest fires make for interesting news, when they are far away, but few utilities think too much about what would happen if their watershed were impacts.  No groundwater utility has thought about impacts on surficial groundwater although that might be an interesting study.  But we should all have plans, should watch our watershed, and be cognizant that far away fires might give us the opportunity to study what could possibly go wrong at our utilities.  Meanwhile, our thoughts are with those in the realm of the conflagrations.  Be Safe!!


July FIRes 2016

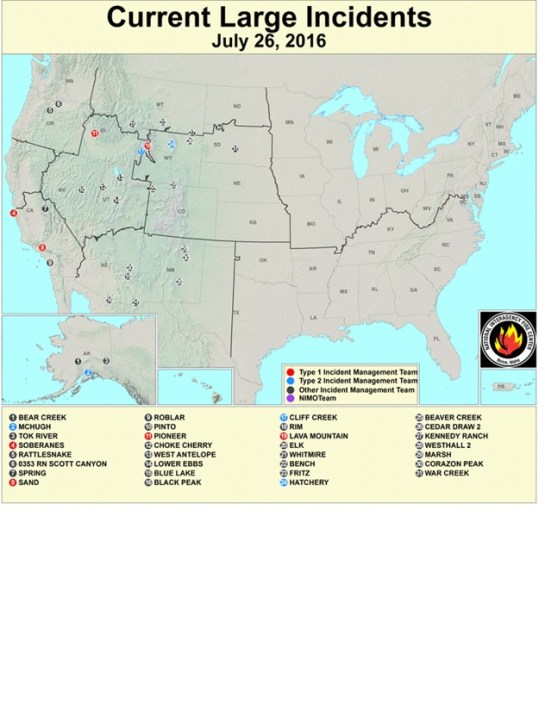
Current Fire map – July 2016 Sources; http://activefiremaps.fs.fed.us/

San Fran Fire sattelite
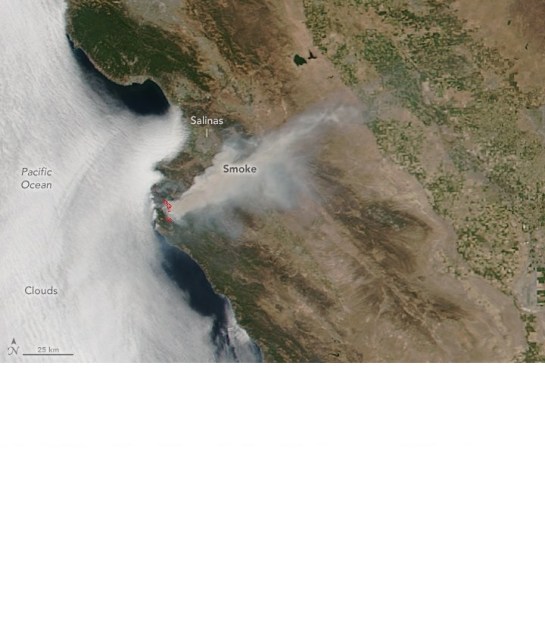
Satellite photo of fire outside San Francisco  Source NASA Earth

CNN photo forest fire CA
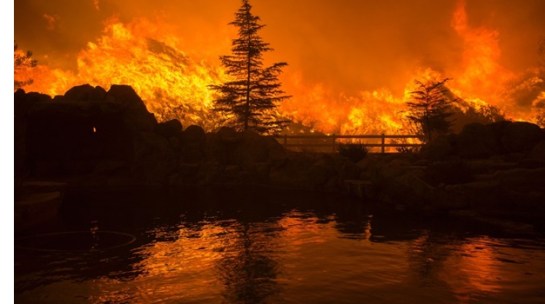
FIre outside Santa Clarita CA July 2016Source CNN
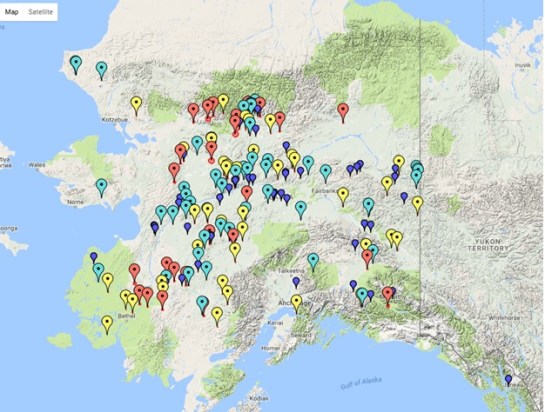
2016 Alaska Fires

Alaska FIres

Advertisement

Collaboration between students, faculty and the real world is an excellent means to integrate students into real world situation and provide them valuable experience.  I have done this with several communities to date.  Below are the installed OASIS street improvements in Dania Beach.  Students did the drafting.  Also a stormwater pipe in Boynton Beach.  Excellent learning experience.  The campus mapping project is one that our Facilities Management Department needed.  Very cool 3D map.  We did stormwater assessments in Davie, plus flood mapping.  Of course the Dania Beach nanofiltration plant, the first LEED Gold water plant in the world.  Still.  Here is the cool thing with working with students – they have all kinds of ideas and have all kinds of tools that they can access – they just need guidance.   They will create tools (our app for asset management). to make the job easier.  Most collaborate well.  And most want to learn about the profession.  As an industry we should promote this more.  Go to the local universities, talk with faculty.  Find the right faculty mentor who is interested in local outreach.  Work with them.  But students should not work free.  Pay or pay in grades.  It’s only fair.


Here is an example of getting to a condition assessment with limited data using power point slides.  Note that where there are categorical variables (type of pipe for example), these need to be converted to separate yes/no questions as mixing.  Categorical and numerical variable do not provide appropriate comparisons = hence the need to alter.  Take a look – but the concept is to predict how well this model explains the break history on this distribution system.  Call me and we can try it on yours….

Step 1  Create a table of assets (this is a small piece of a much larger table).

Asset Dia
water main 2
water main 2
water main 2
water main 2
water main 4
water main 6
water main 6
water main 6
water main 6


Step 2  Create columns for the variables for which you have data (age, material, soil type, groundwater level, depth, traffic, trees, etc.)


Asset breaks in 10 year Dia Age soil traffic Trees depth pressure material Filed estimate of cond.ition
water main 17 2 45 1 1 2 1 55 4 3
water main 11 2 45 2 1 2 1 55 4 3
water main 12 2 45 1 1 2 1 55 4 3
water main 10 2 45 1 1 2 1 55 4 3
water main 2 4 50 1 1 2 1 55 1 2
water main 3 6 60 2 2 2 1 55 1 2
water main 1 6 60 2 2 2 1 55 1 2
water main 0 6 20 1 1 2 1 55 3 1


Step 3  All variables should be numeric.  So descriptive variables like pipe material need to be converted to binary form – i.e. create a column for each material and insert a 1 or 0 for “yes” and “no.”

Step 4 Run Linear regression to determine factors associated with each and the amount of influence that each exerts.  The result will give you a series of coefficientcoefs:

Step 5 – Use this to predict where your breaks will likely be in the next 5-10 years.

Pred breaks

The process is time consuming but provides useful information on the system.  It needs to be kept up as things change, but exact data is not really needed.  And none of this requires destructive testing.  Not bad for having no information.


An asset management program should be developed accordingly to the client’s goals and objectives. It consists of determining the selected area of study, type of system and the quality of data used for evaluation. Before a condition assessment can be determined, an inventory of assets needs to be established – maps, etc. are helpful.  So now you have a map of your water and sewer system and you want to develop a useful system for asset management.  Depending on the accuracy wanted, the data can be gathered in many ways ranging from onsite field investigation which could take a lot of time, to using existing maps, using maps while verifying the structures using aerial photography and video, or field investigations. But most local governments still lack data.  You cannot dig up pipe, or do a lot of destructive testing on buried infrastructure.  So what to do?

The reality is that you have a lot more data than one thinks.  For one thing, most utilities have a pretty good idea about the pipe materials.  Worker memory can be very useful, even if not completely accurate.  In most cases the depth of pipe is fairly similar – the deviations may be known. Soil conditions may be useful – there is an indication that that aggressive soil causes more corrosion in ductile iron pipe, and most soil information is readily available.  Likewise tree roots will wrap around water and sewer pipes, so their presence is detrimental.  Trees are easily noted from aerials.  Likewise road with truck traffic create more vibrations on roads, causing rocks to move toward the pipe and joints to flex.  So with a little research there are at least 5 variables known.  If the break history or sewer pipe condition is known, the impact of these factors can be developed via a linear regression program.  That can then be used as a predictive tool to help identify assets that are mostly likely to become a problem.   We are working on such an example now, but suspect that it will be slightly different for each utility.  Also, in smaller communities, many variables (ductile iron pipe, pvc pipe, soil condition…) may be so similar that differentiating would be unproductive.  That also remains to be seen, which brings up another possible variable- the field perception – what do the field crews recall about breaks?  Are there work orders?  If so do they contain the data needed to piece together missing variables that would be useful to add to the puzzle?

After all we want to avoid this before it happens….

IMG_5040


Asset management plays a vital role to help minimize unnecessary or misplaced spending while meeting the health and environmental needs of a community. The goal is to provide strategic continuous maintenance to the infrastructure before total failure occurs.  Costs should be well distributed over the life of the asset to help avoid emergency repairs. Emergency repairs can cost up to multiple times the cost of a planned repair. Therefore the ultimate goal of asset management is to provide quality, economical infrastructure by identifying the system’s needs and addressing the needs appropriately.  At some point repairs cost more than replacement, or technology may make repairs obsolete.

An asset management program should be developed accordingly to the client’s goals and objectives. It consists of determining the selected area of study, type of system and the quality of data used for evaluation (see Figure 1).  Before a condition assessment can be determined, an inventory of assets needs to be established. Depending on the accuracy wanted, the data can be gathered in many ways ranging from onsite field investigation which could take a lot of time, to using existing maps, using maps while verifying the structures using aerial photography and video, or field investigations. Not doing destructive testing is important to reduce costs.  The question is how you do it.  One project we did was the downtown area of Dania Beach.  You can see the areas that are a problem.

Untitled


Figure 1

Asset Dania

FIgure 2


Public infrastructure has been poorly rated by the American Society of Civil Engineers and most public officials acknowledge the deterioration of the infrastructure we rely on daily.  However, many jurisdictions have limited information about their systems, and little data to use to justify spending.  The resistance to impose fees or taxes to upgrade infrastructure also remains high.  Hence the infrastructure tends to deteriorate further each year.  At present the United States spends about 1.6% of its GNP of infrastructure, as compared to 3.1 % prior to 1980.  Half as much money, and a large portion of that was for growth as opposed to repair and replacement.  Hence the need for better tools for asset management.

Utilities that utilize asset management programs experience prolonged asset life by aiding in rehabilitation and repair decisions while meeting customer demands, service expectation and regulatory requirements. The general framework of asset management programs involves collecting and organizing the physical components of a system and evaluating the condition of these components. The importance and the potential consequences associated with the failure of the individual assets are determined by this evaluation. Managers and operators can then prioritize which infrastructure are most critical to the operation of the system and furthermore which infrastructure to consider for repair, rehabilitation or replacement. It is a continuously reviewed and revised strategy that implements the acquisition, use and disposal of assets to optimize service and minimize costs over the life of the assets. An asset management plan (AMP) considers financial, economic and engineering goals in an effort to balance risk and benefits as they relate to potential improvement to the overall operation of the system.

Over the last 2 years, we have been working to develop a means to quickly, effectively and in a cost efficient manner to collect data and assess public infrastructure using simple, readily available means, without the need for significant training and expertise.  The idea was to use student efforts to coalesce a common evaluation without the need for destructive testing.  There are three successive projects used to improve the collection of data for ultimate use in an asset management program.   Students were provided with Leica and Trimble units to gather data.  For the first project, an app was created by FAU students that included photographic tools and entries to document the asset condition and location and permit offsite QA/QC from the cloud.  This app was initially developed for stormwater, but was updated to include all public assets for the second community. Data retrieval was created to be able to log data directly onto a smart phone or tablet in the field to save time and the information is instantly downloaded to the internet for quality assurance. The collection system also was programmed with a condition index to help with organization A session was held in the field with student groups to normalize the assessment process.  The approach began with an inventory and location of each asset. The assets were field inspected and assessed for condition.  A numbering system and photographic tools was used to document the asset condition.  This was accomplished by physically locating each asset in the field and marking it with a global position system (GPS) coordinate which allowed the data to be populated in a geographic information system (GIS) and organized with the other assets of the system

The results include this senior design project by our geomatics students. It is a 3-dimensional map of all infrastructure from the ground down on FAU’s Boca Raton campus. 800 acres and over 5000 points, many of which must be stitched together.  They also created building extrusions for a future project.  Very cool and useful from a tablet.  So the question is – do you have a 3D map of your utility?

Geomatics Engineering Senior Design Project 2016 (2)


Summer Kids – Get them early

FAU sponsors summer camps for middle schoolers on campus. The camps are a week long.  The kids come it and learn about some aspect of civil engineering.  I did two summer camps for civil engineers – I call it the make it and break it camps, because that is what we do.  Make stuff, then break it.  The kids love the breaking part.  We tried out a series of project – dropping eggs from 2 and 5 stories, concrete Frisbees, concrete cylinders, geotechnical fill made of recyclables, did a little surveying, made bridge. Then broke stuff!  They had fun, but it really speaks to a larger issue.

I see the University of Miami recruiting an 8th grader for the football team.  College and pro sports do this all the time (recall they were scouting LeBron James in middle school or earlier).  Why do we not do this in our industry?  Getting middle schoolers on campus is great; they think it is really cool, but we need to keep in contact.  Future camps, seminars, invitations for research participation, helping with clubs, offering classes, mentoring.  All things we need to do to track the kids right into the college and the industry.  If an FAU professor mentors you and puts your name on a paper, you think that kids is going elsewhere?

Sports sees money in athletes, but because only the athletics are spending money, it makes the athletes seem more important than other professions.  But we all need water.  We all need sewer.  We all need many things we take for granted.  So perhaps the colleges and industry needs to think about how we elevate our profession to those kids we want to have become part of our organization.  Most do not have the talent to play sports, so get left out.  But I am convinced that middle school is the place to start recruiting them our way.  High school is too late and they are too distracted by “life.”  Middle schoolers can be “formed” into future water professionals.  Let’s think on that.

Meanwhile enjoy their work….


June was a tough month and looking back I realize I really didn’t post.  I was in Chicago, spent 2 weeks with middle schoolers, prepared my promotion package, god the doors completed on the house, etc. and suddenly it was the 4th of July.  Yikes time flies.  But it was interesting.  Here I want to talk a little about Chicago.

I went to Chicago to do a 3 day, 12 hour class with elected officials.  Most are board members for their local utility, but they went from a small South Carolina system to San Antonio and St. Paul.  A huge variety.  And we learned a lot.  Obviously the Flint crisis was on their minds.  But I thought the most interesting thing was that these folks understood what happened.  I asked what they thought the real issue was in Flint and the resounding answer was – politics.  Bad decision-making.  Poor preparation.  Notably, not lead service lines.  These people got it.  They read behind the headlines.  Of course these are the officials that wanted to learn more about their water and sewer systems, as opposed to the many that do not take the time to, but interesting nonetheless.

Another issue was talked about was finances.  I ask them to bring their budget, water use, pipelines, etc.  The goal is to do a quick comparison between systems and then discuss what it means (if anything).  I have started doing the exercise each year and we find the same thing – smaller systems cost more per thousand gallons to run than larger systems, so hence their rates must be higher or they are not doing repairs and replacements on a timely basis. This group got that as well and understood that comparisons of their system to others needed to be carefully vetted.  No two system are alike, but size, treatment, terrain can all affect costs to the customer.

We also talked about leadership.  I am applying for an AWWA project on leadership, but when asked, these folks had some great answers. They see leadership as a personal trait (inspiration, vision) as well as being driven by event (negotiating crisis or change), and having the ability to bring people along through the rough patches.  Leadership is an issue that needs more exploration, but I thought this was a good start to preface the larger survey I hope to do for AWWA’s members.

In the meantime, I learned a lot about the Chicago River bridges, enjoyed the planetarium, a Cubs night game, Millenium Park and a walk along the waterfront.  Very cool.

%d bloggers like this: