Archive

engineering


As 2017 gets rolling, we are set to swear in a new President.  The politics are already interesting.  The question is what will change, when and how.  For example there has been an ongoing discussion of infrastructure bills, but aside from WITAF approval, little clear direction has been forthcoming.  We only know that private sector participation will be encouraged.  Of course virtually all projects constructed in the public sector are constructed by private contractors, so how/if that will change is unclear.

It is also unclear which industries will be affected.  There are already comments about not pursuing he renewable energy opportunities  – China sees 13 million jobs in the coming 5 years as their economy cranks up to meet the needs.  They are contributing $360 billion to enhance this sector.  I have previously blogged about potential opportunities in the US to grow renewables.  But they are just like recycling in the 1970s.  Recycling needed to be subsidized until such time as the facilities and processes were in place to make it competitive.  Now for steel and aluminum, it is less costly than virgin iron or bauxite.  That has several benefits to the economy and the environment.

I have previously suggested that those who do the research, develop the solutions and control the patents tend to rule the economy.  The US did in throughout the 20th century.  Energy is the 21st century opportunity and I would hope we don’t cede that elsewhere due to politics.  13 million jobs would really help places in rural America and place like Detroit and Flint which have the workers.  It may be that instead of the federal government doing much in this arena, the state and local officials will lead the charge.  California has been successful to a degree in this regard.  Let’s see if making money will “trump” the politics of oil. That would be good for a lot of local governments that have workers and factories, but not jobs.  That would help people like those in Flint.  And it would help their utilities.  Let’s work on this with our local officials

Advertisement

Many communities that have issue with older infrastructure may suffer from loss of economic opportunities (Flint, Detroit, Cleveland).  This compounds the problem with local capacity for maintenance and report of infrastructure. Many of these issues result from the lack of funding due to the unwillingness of local officials to raise water rates and address hidden infrastructure. Others may feel limited due to the loss of economic activity – Rust Belt cities and the northeast are older; inner cities may be more impacted.  Different areas of the country will have different needs and maybe different magnitudes of need.  Rural communities may not have funding to replace infrastructure.  The first community that abandoned their system was rural.  Newer communities with newer pipe will have far less needs today, but few are taking steps to avoid the infrastructure pitfalls that have hit older communities.  Ultimately these conditions make for a huge backlog of deferred infrastructure investments, mostly in pipe and service lines beneath roads. The only good news is that by correcting the piping, much of the roadway base issues could also be resolved concurrently.

A concurrent problem in the communities hardest hit with infrastructure issues is often that there is pool of skilled labor, but said labor may not be skilled in areas to address their own infrastructure problems.  Likewise youths may be challenged to find work local. The solution to both issues may be similar to that posed by the CETA programs in the late 1970s. In those programs local and state governments were given funds to hire staff to be trained for certain jobs, with the intention that these trained workers would become part of a permanent, expanded workforce.  A similar solution today as a part of an infrastructure bill could be to provide local and state governments for funding for personnel to be trained to perform such work.  The workers could receive training on safety, OSHA issues, and equipment from a local community college or university that would be paid for by the infrastructure bill.  These same people would then be hired by local governments to perform rehabilitation and replacement work, fully funded initially by the federal government s but with an anticipated transition period where by 10 years out, the workforce could be demonstrated to have been expended as a result of the program.

Note that hiring by local governments is a key.  Private sector hiring tends to be job specific and the jobs disappear when the activity moves or ceases.  Hence finding the private sector likely leads only to a temporary increase in labor development.  Local government hiring would more likely increase permanent employment.  The local agencies would need to be given an incentive to encourage this since far too many elected officials see government employment as a negative thing.  This is partly why we have the infrastructure quagmire today.  That attitude needs to change.

The private sector will want their share, and privatization is a confounding issue because people get laid off through privatization and indications are that the middle class gets hurt by privatization (lower wages for the same job).  But the public sector does not manufacture pipe, equipment like backhoes and rollers and other materials would be paid to private vendors in accordance with local and state bid rules.  That would move monies for capital to private vendors.  For large projects the work rules could be applied to contractors much like the ARRA funding requirements – shovel ready and US materials and newly trained staff making up a portion of the work force.  That would meet the tenets of local jobs, fixing local problems with federal dollars for a period of time, perhaps as a mix of grants and low interest loans.

At least 20 years of infrastructure needs exist.  Hence the longer term program could be sustained.  A funding mechanism is in place via state revolving fund programs for a portion of the effort, much like the water, sewer and stormwater funds were channeled through the SRF programs under the ARRA program.  WIFIA and other programs could be used as a dispersal agent, so new bureaucracies would not need to be created.   A prior pattern for implementation is in place and would just need to be “dusted” off an updated.  Bi-partisan support enacted these program in the past and it would seem this would be good for all.

The potential for concern would be raised by private utilities (power, cable, telephone and private water and sewer utilities) which would be effectively shut out of funding, but they are private entities and they have the ability to raise funds on the private equity market.  Capitalism will work well for these organizations, but it does not for most local public works infrastructure systems.  That is why they are public, not private.  Some local governments would resist the requirement to expand the workforce – but that is their choice – a requirement to participate is not implied just as it is not with SRF funds.  Local business communities would likely drive the effort to be involved.

So now we wait and see if anything happens……


The election and post-election discussions have included some concepts about funding for infrastructure.  While this may have been more focused had Clinton been elected, it remains a discussion topic in the Trump White House.  How it would be manifested is a question, with Trump’s faction discussion private cash influxes to make this happen.  The Senate seems to view infrastructure as DOA, which means nothing might occur.  However, in any instances, there needs to be a definition of the word infrastructure and what would qualify for funding.  There are three basic types of infrastructure – public, private and regulated private.  Most SRF programs limit recipients of funding to public entities.

The infrastructure in the public arena falls into three categories which have vastly different types of infrastructures:

Local – water, sewer, stormwater/drainage, local roads, limited bridges.  In larger communities, rail and airports might be included, but the latter is mostly federal subsidies.  Much of water and sewer infrastructure is over 50 years old and is showing signs of weakening.  Buried pipelines are the most at risk.  This would include the 6 million lead services lines in place.  Sewer lines are primarily vitrified clay, also 50+ years old and likely cracked.  Stormwater is corrugated metal and concrete.  Roadway bases in most communities are historical and do not meet today’s standards.  Hence ASCE rates these a D or D-.  Municipal buildings in older communities may also have lead services, asbestos, wood and galvanized pipelines, and other issues to address. The majority of infrastructure under this definition is under local control.

State – highways and bridges – much of America’s commerce depends on these roadways.  25% of bridges need work, 10% are deficient.  Funding for rail and airports is a need from a state perspective.  States may spend more money on transportation that all other infrastructure combined.

Federal – these are very large scale projects like dikes, dams, reservoirs and water transmission systems.  It also includes national parks ($11 billion deficiency), and federal buildings.  The dikes in New Orleans are an example.  However a lot of the funds for these projects are disseminated to locals (like New Orleans), so the actual use may be unclear.

The literature suggests that public investments in infrastructure create at least a 4:1 return.  Good infrastructure is necessary for a vibrant economy.  Deteriorating infrastructure leads to …. Flint, New Orleans after Katrina, and a host of obvious failures.  The impact of climate on communities, particularly sea level rise, can be partially addressed with infrastructure improvements.  Large scale construction can secure jobs both immediately and for the foreseeable future.  The question then is how to secure finding that will lead to jobs, lead to economic development and return on those investments, and will make notable improvements.  That is the challenge at all three levels.  The easiest to address from a sill perspective is state roads and local infrastructure.  From a state perspective the work is focused on highways and transportation.  Locally, the benefit is the local labor force that requires no travel or added overhead.  Just training.  So the question is whether an infrastructure bill can/should have a jobs component built in?


This is an interesting article from the Union of Concerned Scientists.  Should we be designing for climate change within our infrastructure systems?  The obvious answer, and the one that the ASCE code of ethics suggests for engineers, is yes.  If you live in a coastal area like me, and where sea level rise is your enemy, the solutions are somewhat clearer.  But what if you are in one of those areas where the future is far less certain?  How do you plan for uncertain, uncertainty?  A new area to study and maybe find a means to address things by thinking outside the proverbial box?


Designing Infrastructure with Climate Change in Mind: Assembly Bill 2800 Becomes Law


The term algae encompass a variety of simple structures, from single-celled phytoplankton floating in the water, to large seaweeds.  Algae can be single-celled, filamentous or plant-like, anchored to the bottom.  Algae are aquatic, plant-like organisms – phytoplankton.  Phytoplankton provides the basis for the whole marine food chain. Phytoplankton need light to photosynthesize so will therefore float near the top of the water, where sunlight reaches it.  Light is the most limiting factor for algal growth, followed by nitrogen and phosphorus limitations), but other nutrients are required including carbon, silica, and other micronutrients. These microscopic organisms are common in coastal areas.  They proliferate through cell division.

A natural progression occurs in many water bodies, from diatoms, to green algae to yellow/brown to blue-green, with time and temperature.  The environment is important.  Southern waters are characterized as being slow moving, and warm.  This encourages cyanobacteria – or blue green algae.  The introduction of nutrients is particularly difficult as it accelerates the formation of the blue green algae. Blue-green algae creates the bright green color, but is actually an end-of-progression organism.

If cells are present in the water mass in large numbers an algal bloom occurs.  An algal bloom is simply a rapid increase in the population of algae in an aquatic system. Blooms may occur in freshwater as well as marine environments. Colors observed are green, bright green, brown, yellowish-brown, or red, although typically only one or a few phytoplankton species are involved and some blooms may be recognized by discoloration of the water resulting from the high density of pigmented cells.

So the desire for development created the idea to drain the swamp, which led to exposure of dark, productive soil that led to farming, which lead to fertilizers, which led to too much water, and water pollution leading to algae.  A nice, predictable progression created by people.  So what is the solution?


The reliability of the assets within the area of interest starts with the design process in the asset management plan. Decision-making dictates how the assets will be maintained and effective means to assure the maximum return on investments. Through condition assessment, the probability of failure can be estimated. Assets can also fail due to a growing area that may contribute to exceeding its maximum capacity. Operation and maintenance of the assets are important in reassuring a longer life span as well as getting the most out of the money to be spent. Prioritizing the assets by a defined system will allow for the community to see what areas are most susceptible to vulnerability/failure, which assets need the most attention due to their condition, and where the critical assets are located in relation to major public areas (hospitals, schools, etc.) with a high population.

So what happens when conditions change?  Let’s say sea levels are rising and your land is low.  What would the potential costs be to address this?  Better yet, what happens if it rains? We looked at one south Florida community and the flood stage for each based on 3 storm events: the 1:10 used by FDOT (Assumes 2.75 inches in 24 hours), the Florida Building Code event that includes a 5 in in one hour event (7 in in 24 hrs), and the 3 day 25 year event (9.5-11 inches).

Of no surprise is that the flooding increases as rainfall increases.  Subsequent runs assumed revisions based on sea level rise. The current condition, 1, 2 and 3 ft sea level rise scenarios were run at the 99 percentile groundwater and tidal dates and levels.  Tables 2-5 depict the flood stage results for each scenarios.  The final task was designed to involve the development of scenarios whereby a toolbox options are utilized to address flooding in the community.  Scenarios were to be developed to identify vulnerabilities and cost effectiveness as discussed previously.

The modeling results were then evaluated based of the accompanying infrastructure that is typically associated with same.  A summary of the timelines and expected risk reductions were noted in the tables associated with storm and SLR scenarios.  This task was to create the costs for the recommended improvements and a schedule for upgrading infrastructure will be developed in conjunction with staff.  Two issues arise.  First, the community needs to define which event they are planning to address and the timelines as the costs vary form an initial need of $30 million to over $300 million long-term.  Figure 1 shows how these costs rise with respect to time.  The long-term needs of $5 million per 100 acres matches with a prior effort in Palm Beach County.

SLR costs

Figure 1  Summary of Costs over the 3 ft of potential sea level Rise by 2011, under the 3 storm planning concepts.


scan063

“Or is running a local government like s business killing it?”

I had an interesting conversation at a conference recently.  The people I was talking to were advanced in their careers and the discussion moved toward the outlook on management in public settings. Once upon a time, most public works and utility managers were civil engineers, but often they were criticized because they were focused on the engineering aspects as opposed to the people aspects of the community.  Their focus was public health and making sure things operated correctly.  Most did whatever was needed to accomplish that.

This led to schools of public administration, which actually started educating some of those same engineers about management of large public organizations, organizational theory, human resource, accounting and planning  I did all that myself at UNC-Chapel Hill.  The goal was to understand finances, people, community outreach, the need to engage citizens and as well as public service.  The outcomes were providing good service.  That however tends to cost a little more than operations although there are opportunities to be a bit entrepreneurial.

So back to the people in the conversation.  They noted that sometime in the 1980s or early 1990s the MPAs were being replaced by MBAs as politicians were focusing on operating “like a business.”  Looking at the MBAs out there, the comment was that business schools do not focus on service, but profits to shareholders, and the training is to cut unproductive pieces that detract from the bottom line.   Hence investments do not get made if the payback is not immediate.  Service is not a priority unless it helps the bottom line.  In a monopoly (like a local government), there are no other option, so service becomes a lessor priority.

So it brought up an interesting, but unanswerable question for now: has the move to more business trained people in government created some of the ills we see?  The discussion included the following questions/observations (summarized here):

  1. Many water and sewer utilities are putting a lot of time and effort into customer service and outreach now after years of criticism for failing to communicate with customers. That appears symptomatic of the monopoly business model.
  2. Our investments in infrastructure decreased significantly after 1980, and many business people focus on payback – so if the investment does not payback quickly, they do not pursue them. How does that impact infrastructure investments which rarely pay back quickly (Note that I have heard this argument from several utility directors with business backgrounds in very recent years, so the comments are not unfounded).  It does beg the questions of whether the business focus compounds our current infrastructure problems.
  3. Likewise maintenance often gets cut as budgets are matched to revenues as opposed to revenues matched to costs, another business principle. Run to failure is a business model, not a public sector model. Utilities can increase rates and we note that phones, cable television, and computer access have all increased in costs at a far faster rate that water and sewer utilities.

Interestingly though was the one business piece that was missing:  Marketing the value of the product (which is different than customer service).  Marketing water seems foreign to the business manager in the public sector.  The question arising there is whether that is a political pressure as opposed to a forgotten part of the education.

I would love to hear some thoughts…


The average is 4% of visible infrastructure is in poor condition.  Actually 4-6% depending on the municipality.  And this was visible infrastructure, not buried, but there is not particular reason to believe the below ground infrastructure is somehow far worse off.  Or better.   That 4-6% is infrastructure that needs to be fixed immediately, which means that as system  deteriorate, there is catch –up to do.  The good news is many of the visible problems were broken meter boxes, damaged valve boxes, broken curbs and broken cleanouts- minor appearing issues, but ones that likely require more ongoing maintenance that a water main.  And the appearance may be somewhat symptomatic – people perceive that the system is rundown, unreliable or poorly maintained when they see these problems.  It raises a “Tipping Point” type discussion.  “Tipping Points” Is a book written by Malcolm Gladwell that I read last year (great book – my wife found it in a book exchange for free in Estes Park last summer).  It was along a similar vein of thought as the Freakanomics books – the consequences of certain situations may be less clear than one thinks.  The Tipping point that is most relevant is crime in New York in the early 1990s after Bernard Goetz shot several assailants in the subway.  The problem was significant and the subways were thought to be among the higher risk areas.  The new police chief and Mayor decided that rather that ignore the petty crimes (like many large cities do), they would pursue those vigorously.  So fare hopping on the train and the like were challenged immediately.  They decided that no graffiti would be visible on the subways and cleaned cars every night to insure this remained the case.  Cars with graffiti were immediately removed from service.  New subway cars were ordered.  Pride and public confidence improved.  Crime dropped.  The impact of their efforts was that people recognized that criminal behavior would not be tolerated and fairly quickly criminal activity decreased.  It was a big success story, but the underlying reasons were less discussed, but easily transferrable to our infrastructure.  If we have broken valve boxes, meters, cleanouts, storm drains etc., the same perceptions of a rundown community rise.  Rundown communities lead to a loss of public confidence and trust and pride.   And none of those help our mission or our efforts to increase infrastructure spending.  4% might not look like much, but it can drastically change the perception of the community.  So let’s start to fix those easy things; and document that we did in our asset management programs.

IMG_4677


How many utilities have a 3D map of their infrastructure?  Not many I bet.  But FAU does.  Here is a recently completed project we did with students and the Facilities Maintenance staff at FAU (costs involved).  They needed better mapping and will tie this to their work order system.  It was an excellent opportunity for two groups within one organization that otherwise seem to have little in common wot work toward a great project.  We will be inputting this data into an online asset management system this summer along with some data for Dania Beach so they will have a portion of their utility system in 3D also.  This is part of a tiny project we did for their downtown area.

GIS is a powerful tool and one utilities should embrace wholeheartedly.  There is so much more than mapping to do.  Data gathering in critical, but with Leica and Trimble units, a lot of data can be gathered easily.  LiDAR can be expensive, but the value is tremendous.  You can see that the FAU system is laid on a 3D LiDAR topographic map (6 in vertical accuracy).  Asset condition assessments were also done concurrently, which adds a lot of information to the system (all assets were also photographed and linked).  Drawing files can be downloaded and extruded from 2D to 3D. Engineers know GIS or can learn it, which makes a fully expanded GIS system for the utility easy to derive if the time is spent.  This is a valuable tool when linked to work orders and asset management programs.

So is your utility in 3D?  Capture


My grandmother lost here summer cabin outside of Grayling, Michigan in the Great Crawford County fire on 1990.  My grandfather had hauled the cabin and out buildings up to Grayling by rail from Detroit in the 1920s (some old houses my Great Grandmother had owned).  It was one of many fires that year, but an early one caused by significantly less snow over the prior winter, high winds, and carelessness.   The cabin was gone before anyone could react as it appears to have been in the dead center of the moving flames.  I recall the story on CNN, but no one realized exactly where it was.  My grandmother never recovered.  She wasn’t the only one.  20 year later there are trees.

Forest fires happen with increasing frequency. Today in Southern California, the Sand Fire has set more than 35,000 acres of the Santa Clarita Valley ablaze.  Difficulties fighting it are not limited to temperatures hitting 101 degrees in the area and dried brush from 5 years of drought conditions.  The Soberanes Fire in Monterey County has burned 16,100 acres along the California coast between Carmel and Big Sur. The fire is bigger than the size of Manhattan.  The 778 acre McHugh Fire located on the steep terrain south of Anchorage, Alaska.  Looking at the map, it seems the west is on fire.  A larger and larger portion of the US Forest Services’ budget gets spent on fire-fighting each year – 67% in 2016.  Yet fires on Forest Service property account for only 20% of the total fire nationally (1.9 million acres or a total of over 10 million acres in 2015), but this total amount is increasing.  Warmer weather in the west has increased the length of fire season, drought has increased the risk, budgets are stagnant so means to prevent fire intensity have been reduced, The only good news is that a University of Vermont study suggests that areas where pine beetle has killed trees is actually thinner and less at risk that heathier forests, if that is a “good” thing.

My friend Dr. Chi Ho Sham did some work on forest fires on watersheds a few year back.  He found that forest fires have obvious impacts on people and our customers, but also our water supplies and our water supplies.  The ash runs off into streams and is difficult to remove at water plants because it is so fine.  Areas burned are far more subject to erosion after rain of snow melt thereby creating a need for more treatment at water plants.  This will go on for some time after the rain until groundcover can re-establish itself.  Fire retardant and water drops combat some fires although the retardant shows up in streams and water supplies with adverse impacts.  Dams and reservoirs will need more frequent dredging due to buildup, and wildlife equilibrium will be disrupted.  Forest fires make for interesting news, when they are far away, but few utilities think too much about what would happen if their watershed were impacts.  No groundwater utility has thought about impacts on surficial groundwater although that might be an interesting study.  But we should all have plans, should watch our watershed, and be cognizant that far away fires might give us the opportunity to study what could possibly go wrong at our utilities.  Meanwhile, our thoughts are with those in the realm of the conflagrations.  Be Safe!!


July FIRes 2016

Current Fire map – July 2016 Sources; http://activefiremaps.fs.fed.us/

San Fran Fire sattelite
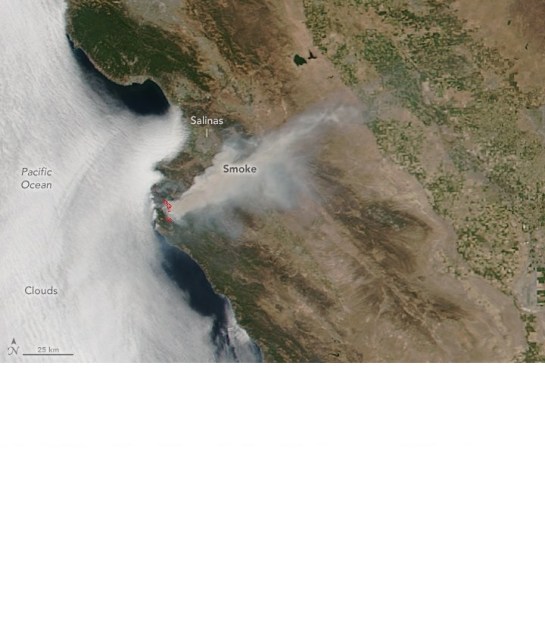
Satellite photo of fire outside San Francisco  Source NASA Earth

CNN photo forest fire CAFIre outside Santa Clarita CA July 2016Source CNN

2016 Alaska Fires

Alaska FIres

%d bloggers like this: