Archive

Education


Welcome to Kansas, the bastion of how not to run a state, but claim things are just dandy.  I noted in a prior blog that Kansas has no reserves.  And apparently a $350 million deficit in 2016, a continuing trend for a number of years now.  And bigger deficits to come.  Kansas is the poster child of why cutting taxes a lot does not work.

How did they get here?  The state governor and legislature decided that cutting taxes spurs economic growth.  So if you cut a lot of taxes, you get lots of growth. They cite the Laffer curve, a  totally discredited economic tool drawn on the back of a napkin  by Arthur Laffer at a 1974 dinner to argue why Gerald Ford should not raise taxes.  On the face of it it makes no sense but that has not stopped supply side politicians from using it for nearly 40 years  to cut taxes.  The problem, it is wrong.

Cutting taxes does not spur enough economic growth to make up for the loss in taxes when you go down the Kansas role.  If you s cut them too much, it is really hard to raise them if you run short.  The result is that  economic growth in most of Kansas will be stunted for years due to the lack of investment in Kansans.  Now you would think that Kansans would be up in arms about the poor stewardship by elected officials. But no.  See if you get constant bad news, just stop reporting revenues and deficits.  No news is good news right?  Welcome to Kansas!

http://www.governing.com/topics/finance/gov-kansas-connecticut-budget-news.html

Advertisement

scan063

“Or is running a local government like s business killing it?”

I had an interesting conversation at a conference recently.  The people I was talking to were advanced in their careers and the discussion moved toward the outlook on management in public settings. Once upon a time, most public works and utility managers were civil engineers, but often they were criticized because they were focused on the engineering aspects as opposed to the people aspects of the community.  Their focus was public health and making sure things operated correctly.  Most did whatever was needed to accomplish that.

This led to schools of public administration, which actually started educating some of those same engineers about management of large public organizations, organizational theory, human resource, accounting and planning  I did all that myself at UNC-Chapel Hill.  The goal was to understand finances, people, community outreach, the need to engage citizens and as well as public service.  The outcomes were providing good service.  That however tends to cost a little more than operations although there are opportunities to be a bit entrepreneurial.

So back to the people in the conversation.  They noted that sometime in the 1980s or early 1990s the MPAs were being replaced by MBAs as politicians were focusing on operating “like a business.”  Looking at the MBAs out there, the comment was that business schools do not focus on service, but profits to shareholders, and the training is to cut unproductive pieces that detract from the bottom line.   Hence investments do not get made if the payback is not immediate.  Service is not a priority unless it helps the bottom line.  In a monopoly (like a local government), there are no other option, so service becomes a lessor priority.

So it brought up an interesting, but unanswerable question for now: has the move to more business trained people in government created some of the ills we see?  The discussion included the following questions/observations (summarized here):

  1. Many water and sewer utilities are putting a lot of time and effort into customer service and outreach now after years of criticism for failing to communicate with customers. That appears symptomatic of the monopoly business model.
  2. Our investments in infrastructure decreased significantly after 1980, and many business people focus on payback – so if the investment does not payback quickly, they do not pursue them. How does that impact infrastructure investments which rarely pay back quickly (Note that I have heard this argument from several utility directors with business backgrounds in very recent years, so the comments are not unfounded).  It does beg the questions of whether the business focus compounds our current infrastructure problems.
  3. Likewise maintenance often gets cut as budgets are matched to revenues as opposed to revenues matched to costs, another business principle. Run to failure is a business model, not a public sector model. Utilities can increase rates and we note that phones, cable television, and computer access have all increased in costs at a far faster rate that water and sewer utilities.

Interestingly though was the one business piece that was missing:  Marketing the value of the product (which is different than customer service).  Marketing water seems foreign to the business manager in the public sector.  The question arising there is whether that is a political pressure as opposed to a forgotten part of the education.

I would love to hear some thoughts…


How many utilities have a 3D map of their infrastructure?  Not many I bet.  But FAU does.  Here is a recently completed project we did with students and the Facilities Maintenance staff at FAU (costs involved).  They needed better mapping and will tie this to their work order system.  It was an excellent opportunity for two groups within one organization that otherwise seem to have little in common wot work toward a great project.  We will be inputting this data into an online asset management system this summer along with some data for Dania Beach so they will have a portion of their utility system in 3D also.  This is part of a tiny project we did for their downtown area.

GIS is a powerful tool and one utilities should embrace wholeheartedly.  There is so much more than mapping to do.  Data gathering in critical, but with Leica and Trimble units, a lot of data can be gathered easily.  LiDAR can be expensive, but the value is tremendous.  You can see that the FAU system is laid on a 3D LiDAR topographic map (6 in vertical accuracy).  Asset condition assessments were also done concurrently, which adds a lot of information to the system (all assets were also photographed and linked).  Drawing files can be downloaded and extruded from 2D to 3D. Engineers know GIS or can learn it, which makes a fully expanded GIS system for the utility easy to derive if the time is spent.  This is a valuable tool when linked to work orders and asset management programs.

So is your utility in 3D?  Capture


Collaboration between students, faculty and the real world is an excellent means to integrate students into real world situation and provide them valuable experience.  I have done this with several communities to date.  Below are the installed OASIS street improvements in Dania Beach.  Students did the drafting.  Also a stormwater pipe in Boynton Beach.  Excellent learning experience.  The campus mapping project is one that our Facilities Management Department needed.  Very cool 3D map.  We did stormwater assessments in Davie, plus flood mapping.  Of course the Dania Beach nanofiltration plant, the first LEED Gold water plant in the world.  Still.  Here is the cool thing with working with students – they have all kinds of ideas and have all kinds of tools that they can access – they just need guidance.   They will create tools (our app for asset management). to make the job easier.  Most collaborate well.  And most want to learn about the profession.  As an industry we should promote this more.  Go to the local universities, talk with faculty.  Find the right faculty mentor who is interested in local outreach.  Work with them.  But students should not work free.  Pay or pay in grades.  It’s only fair.


Public infrastructure has been poorly rated by the American Society of Civil Engineers and most public officials acknowledge the deterioration of the infrastructure we rely on daily.  However, many jurisdictions have limited information about their systems, and little data to use to justify spending.  The resistance to impose fees or taxes to upgrade infrastructure also remains high.  Hence the infrastructure tends to deteriorate further each year.  At present the United States spends about 1.6% of its GNP of infrastructure, as compared to 3.1 % prior to 1980.  Half as much money, and a large portion of that was for growth as opposed to repair and replacement.  Hence the need for better tools for asset management.

Utilities that utilize asset management programs experience prolonged asset life by aiding in rehabilitation and repair decisions while meeting customer demands, service expectation and regulatory requirements. The general framework of asset management programs involves collecting and organizing the physical components of a system and evaluating the condition of these components. The importance and the potential consequences associated with the failure of the individual assets are determined by this evaluation. Managers and operators can then prioritize which infrastructure are most critical to the operation of the system and furthermore which infrastructure to consider for repair, rehabilitation or replacement. It is a continuously reviewed and revised strategy that implements the acquisition, use and disposal of assets to optimize service and minimize costs over the life of the assets. An asset management plan (AMP) considers financial, economic and engineering goals in an effort to balance risk and benefits as they relate to potential improvement to the overall operation of the system.

Over the last 2 years, we have been working to develop a means to quickly, effectively and in a cost efficient manner to collect data and assess public infrastructure using simple, readily available means, without the need for significant training and expertise.  The idea was to use student efforts to coalesce a common evaluation without the need for destructive testing.  There are three successive projects used to improve the collection of data for ultimate use in an asset management program.   Students were provided with Leica and Trimble units to gather data.  For the first project, an app was created by FAU students that included photographic tools and entries to document the asset condition and location and permit offsite QA/QC from the cloud.  This app was initially developed for stormwater, but was updated to include all public assets for the second community. Data retrieval was created to be able to log data directly onto a smart phone or tablet in the field to save time and the information is instantly downloaded to the internet for quality assurance. The collection system also was programmed with a condition index to help with organization A session was held in the field with student groups to normalize the assessment process.  The approach began with an inventory and location of each asset. The assets were field inspected and assessed for condition.  A numbering system and photographic tools was used to document the asset condition.  This was accomplished by physically locating each asset in the field and marking it with a global position system (GPS) coordinate which allowed the data to be populated in a geographic information system (GIS) and organized with the other assets of the system

The results include this senior design project by our geomatics students. It is a 3-dimensional map of all infrastructure from the ground down on FAU’s Boca Raton campus. 800 acres and over 5000 points, many of which must be stitched together.  They also created building extrusions for a future project.  Very cool and useful from a tablet.  So the question is – do you have a 3D map of your utility?

Geomatics Engineering Senior Design Project 2016 (2)


I love South Park.  Parody on the ridiculous stuff that goes on every day.  Most of the time the writers hit the target.  And I laugh.  There is an episode of South Park where the residents cry out about immigrants that “took ‘r jobs!!”  And then they go on to “rabble rabble rabble” because they don’t know what else to do.  And of course in the Republican debates, the illegal immigrant issue has arisen.  But how big a problem is this really?  And are these jobs Americans really want to do, or is the illegal immigrant market basically taken the bottom rung because today’s workers don’t want those jobs.

So first, what are those jobs? Steven A. Camarota and Karen Zeigler at the Center for Immigration Studies analyzed the census data from 2010 and found there to be 472 “professions” that could be categorized. Of the 472 civilian occupations, only six would be categorized as being “majority immigrant (legal and illegal).” The six are:

  • Plasterers,
  • Personal appearance workers
  • Sewing machine operators
  • Garment manufacturing, and
  • Agricultural occupations (2)

They note that these six occupations account for 1 percent of the total U.S. workforce and that even in those fields, native-born Americans still comprise 46 percent of workers even in these occupations.  In high-immigrant occupations, 59 percent of the natives have no education beyond high school, compared to 31 percent of the rest of the labor force.

Many jobs often thought to be overwhelmingly immigrant (legal and illegal) are in fact majority native-born:

  • Maids and housekeepers: 51 percent native-born
  • Taxi drivers and chauffeurs: 58 percent native-born
  • Butchers and meat processors: 63 percent native-born
  • Grounds maintenance workers: 64 percent native-born
  • Construction laborers: 66 percent native-born
  • Porters, bellhops, and concierges: 72 percent native-born
  • Janitors: 73 percent native-born

There are 67 occupations in which 25 percent or more of workers are immigrants (legal and illegal). In these high-immigrant occupations, there are still 16.5 million natives — accounting for one out of eight natives in the labor force.

Illegal immigrants work mostly in construction, cleaning, maintenance, food service, garment manufacturing, and agricultural occupations. They found no occupations in the United States in which a majority of workers are illegal immigrants. Even in the overwhelming majority of workers even in these areas are native-born or legal immigrants.

So then the question really is this – are they taking jobs that Americans want to do?  Historically the answer is no.  Both the agricultural and garment industries have struggled to get native workers.  The work is long, hard, and conditions difficult.  If you have education, you can find a better, higher paying job.  No American kids grows up wanting to pick beans or sew for a living.  Immigrants have always been the source of labor.  Plasterers are difficult to find when construction jobs are plentiful so that is the one exception to low paying jobs that no one wants to do.  Construction has always looked for labor help and certain specialties. And there are not that many of these jobs in comparison to the others on the list.  So for those 5 jobs the answer is no.  Same goes for most of the next seven (Maids, housekeepers, janitors, bellmen, etc.).  I should note that my great grandmother (an immigrant) cleaned houses, but made sure none of her kids would by making them get an education.  Ditto for my uncle who was a janitor.  Neither was well educated, but their kids were.  And there kids were far better  off economically.

So political rhetoric aside, the answer seems to be that immigrants do in fat take those jobs that we do not want to do that require less education.  These jobs mostly pay minimum wage. The study notes that 59 percent of the natives have no education beyond high school, compared to 31 percent of the rest of the labor force.   Get educated – get a job that pays better than minimum wage.  Seems like I have heard that rhetoric as well.
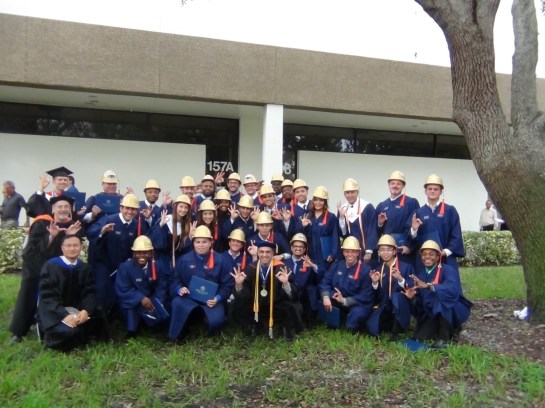

There is an interesting ethical issues that arises in this discussion also. Engineers are entrusted to protect the public health, safety and welfare. When there were few people, projects did not impact many so little thought was given to the “what could possible happen” question. We are still paying for that. When bad things happen, the precedent has unfortunately been set that somehow “the government” will resolve this. An old 1950s BOR director said he thought he was “a hero because he helped create more room for people” in the west with dams and water projects. He did accomplish that, except that while there were more people coming, the resources were never analyzed for sustainability, nor the impact it might have on the existing or potential future economic resources. But once the well runs dry, I think we just assumed that another solution would resolve any issue. But what is if doesn’t?

There are many water supply examples, where we have engineered solutions that have brought water or treated water to allow development. South Florida is a great example – we drained half a state. But no one asked if that development was good or appropriate – we drained off a lot of our water supply in the process and messed up the ecological system that provided a lot of the recharge. No one asked in the 1930 if this was a good idea.

Designing/building cities in the desert, designing systems that pump groundwater that does not recharge, or design systems that cannot be paid for by the community – we know what will happen at some point. Now that there are more people, conflicts become more likely and more frequent. Most times engineers are not asked to evaluate the unintended consequences of the projects they build. Only to build them to protect the public health safety and welfare while doing so, but from a specific vantage point.

So if you know a project will create a long-term consequence, what action should you take? So the question is whether there is a conflict between engineers meeting their obligations to the public and economic interests in such cases?  Or should we just build, build, build, with no consideration of the consequences?


A couple weeks ago we conducted a one week camp for middle schoolers at our engineering department.  So 15 kids, 12-14 and what do my Tas Julia and Dylan, and I do to entertain them, keep them out of trouble, be safe and have them learn something?  Well of course build things and destroy them or course!.  So as you can see in the photos, we did concrete cylinders, popcicle stick buildings, popcicle stick dams (for water), spaghetti bridges, and filters.  And spent a whole day destroying all of it.  Of course then they were required to do a short presentation before they could have pizza, but at this age, they did a decent job.  If fact there were some really smart kids in the group.  They did great with the concrete – competing with older kids on the mix.  The buildings were interesting – triangles work well, and glue will help make your spaghetti bridge bend, but not break.  Lots of glue.  Ridiculous amounts of glue.  But it was fun, and several of them want to be civil engineers.  So get them while they are young!

IMG_2928 IMG_2924IMG_2933 IMG_2920IMG_2937 IMG_2893 IMG_2894 IMG_2904


As technology advances I have an observation, and a question that needs to be asked and answered.  And this could be a pretty interesting question.  Back in the day, say 100 or 150 years ago, there were not so many people.  Many activities occurred where there were few people and impacts on others were minimal.  In some cases ecological damage was significant, but we were not so worried about that because few people were impacted by that ecological damage.  In the 20th century, in urban locations, the impact of one’s activities on others became the basis for zoning laws – limiting what you could do with your property because certain activities negatively impacted others.  And we certainly had examples of this – Cuyahoga River burning for one.  Of course this phenomenon of zoning and similar restrictions was mostly an urban issue because there potential to impact others was more relevant in urban areas.  We also know that major advances in technology and human development tend to occur in population centers (think Detroit for cars, Pittsburgh and Cleveland for steel, Silicon Valley, etc.).  People with ideas tend to migrate to urban areas, increasing the number of people and the proximity to each other.  Universities, research institutions, and the like tend to grow up around these industries, further increasing the draw of talent to urban areas.  The observation is that urban areas tend to have more restrictions on what people do than rural areas.  So the question – do people consciously make the migration to urban areas realizing that the migration for the potential financial gain occur with the quid pro quo of curbing certain freedoms to do as you please?  Of does this artifact occur once they locate to the urban areas?  And is there a lack of understanding of the need to adjust certain activities understood by the rural community, or does it become yet another point of philosophical or political contention?  I have blogged previously about the difference between rural and urban populations and how that may affect the approach of utilities, but read a recent article that suggests that maybe urban citizens accept that financial gains potential of urban areas outweighs the need to limit certain abilities to do as you please to better the entire community.  They are motivated by potential financial opportunities that will increase their standing and options in the future.  So does that mean urban dwellers understand the financial tradeoff differently than rural users?  Or is it a preference issue.  And how does this translate to providing services like water to rural customers, who often appear to be more resistant to spending funds for improvements?  While in part their resistance may be that their incomes tend to be lower, but is their community benefit concern less – i.e. they value their ability to do as they please more than financial opportunities or the community good?  I have no answer, but suggest that this needs some further study since the implications may be significant as rural water systems start to approach their life cycle end.

%d bloggers like this: