Archive

Rural Utilities


photo 2
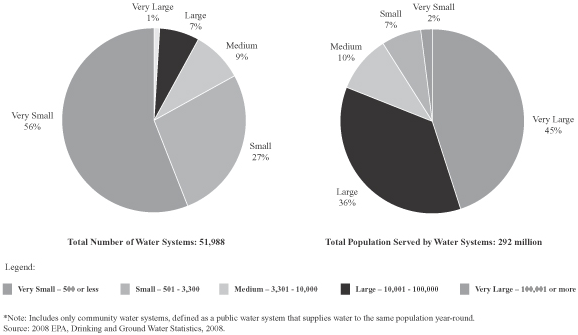
Over the holidays there were a couple articles that came out about groundwater issues in the US, mostly from the declining water level perspective.  I also read a paper that suggested that rising sea level had a contribution from groundwater extraction, and of course USGS has maps of areas where the aquifer have collapsed as a result of overpumping.  In 2009 USGS published a report that showed a large areas across the country with this issue.  The problem is that of the 50,000 community water systems in the US, 500 serve over 50% of the population, and most of them are surface water plants.  There are over 40,000 groundwater systems, but most are under 500 customers.  Hence, groundwater is under represented at with the larger water associations because the large utilities are primarily surface water, while the small systems are groundwater. AWWA has difficulty reaching the small systems while RWA and NGWA reach out to them specifically.  But the small utility seems more oriented to finding and producing water and operating/maintaining/drilling wells than the bigger impact of groundwater use.  It is simply a matter of resources.  I ran a system like that in North Carolina, and just getting things done is a huge issue.  A couple of my medium size utility clients have the same problem.

The bigger picture may contain the largest risk.  Changing water supplies is a high cost item.  We have seen a couple examples (surface water) as a result of drought.  We saw Wichita Falls and Big Springs TX go the potable reuse route due to drought.  California is looking at lots of options. Both have had rain lately (Wichita Falls discontinued the potable reuse when the reservoir got to 4% of capacity).  Great, but someone is next.  Droughts come and go, and the questions is how to deal with them.

Groundwater supposedly is a drought-proof problem, but is it?  Groundwater has been a small utility solution, as it has been for agriculture.  But aquifer require recharge and water limited areas do not have recharge.  The result is a bigger problem – overpumping.  Throughout the west/southwest, Plains states, upper Midwest (WI, MN, IA), southeast (SC, NC), we see this issue.  Most of these areas have limited surface water so never developed much historically.  Rural electrification changes that because it made is easy to put in an electric pump to pull water out of the ground in areas that never had a lot of water on the surface, and hence were not farmed much. Pumps made is easier to farm productively, which led to towns. However, our means to assess recharge are not very good, especially for confined aquifers. The lowering water levels USGS and state agencies see is an indication that recharge is normally over estimated giving a false picture of water availability.  If your aquifer declines year after year, it is not drought – it is mining of the aquifer. You are sucking it dry like the eastern Carolinas did.  But, like many negative things, there is a lack of willingness to confront the overpumping issue in many areas. There are many states with a lack of regulations on groundwater pumping.  And I still think groundwater modeling use is limited to larger utilities, when smaller, rural systems may be most in need of it due to competing interests.

Concurrently, I think there is a tendency to oversell groundwater solutions (ASR, recharge), groundwater quality and the amount of available water (St George, UT).  Easy, cheap, limited treatment should not be the only selling point.  That leads to some curious decisions like some areas of California north of LA the utilities do not treat hard groundwater – then tell residents they cannot use softeners because of the salt in the wastewater prevents it from being used for reuse.  The reason they do not treat – cost, but it makes things difficult for residents.  The fact is we do not wish to confront is the realization that for many places, groundwater should probably be the backup plan only, not the primary source.

That leads to the question – what do we do about it when every politician’s goal is for their community to grow?  For every farmer to grow more crops?  But can they really grow sustainably?  DO we not reach a point where there are no more resources to use?  Or that the costs are too high?  Or that competition become unruly?  The growth and groundwater use ship is sailing, but in to many cases they do not see the rocks ahead.

Advertisement

In this blog we are going to talk about trends in the power industry and how they may affect utilities.  One of the ongoing themes of this blog is that to be leaders in the field, we need to be cognizant of what others are doing and how those actions might affect utility operations.  Power is a big cost for utilities – often 10-15% of the total operations costs where a lot of pumping is involved. In most communities, the utility system is among the largest consumers of power, which is why many utilities have load control agreements in place – power companies can off-load power demands by having the utilities go to onsite generators.  Our community’s building account for 70% or more of local energy use.

The need for power is expanding, albeit at a lower rate that population growth in many communities.  This is because new building construction measures tend to insulate better and install more energy efficient equipment.  Power companies often will subsidize these improvements to reduce the need for more expensive plant expansions.  Where expansions are needed, purchase/transfer agreements or renewables are often a convenient answer.

But long-term we are seeing that the power industry is changing in other ways too.  Already we see a migration away from coal for power generation.  This was occurring before the new regulations were in place for carbon dioxide.  Certain utility companies like NextEra, the largest wind and solar power generator in the US, and the parent of Florida Power and Light, have reduced greenhouse gas emissions from their plants by converting to other sources like combined heat and power (CHP), and increasing efficiency.  The typical oil or coal power plant is 30-35% efficient, while the newer gas turbine systems are up to 45% efficient.  That makes a big difference in costs as well as emissions when gas emissions are half the coal and oil emissions.  NextEra is well placed for carbon trading, a concept some fight, but the US had been emission trading since the early 1990s, so carbon trading markets are already in place.  The only thing needed is the regulations to put them into play.  Buy that NextEra stock now and hope for carbon trading!

But NextEra is not the only likely winner under this carbon trading scenario.  ExxonMobile is big into gas, Exelon is big in the nuclear power industry, Siemens and General Electric, which make wind and gas turbines, are also likely to see growth.  All have poised themselves years ago as the impact of carbon dioxide becomes more apparent.  Most of the industry executives acknowledge climate issues and recognize that people will expect the industry to do its part (the Koch brothers aside).  Many power generators like ConEd and FPL are making changes as well, in advance of the regulatory requirements to do so.  They see it as good business.  They also see it as a means to make more power at a given facility (by increasing efficiency) while reducing water use.  Water use can be a limiting factor, so we will discuss that in a couple days…


The good news is that for many local governments, property values are up and so is the economy, especially in urban areas.  However that does not mean that the budget approval difficulties of 2009-2012 have passed or been resolved.  In fact the arguments may continue despite improvements in financial position.  Why?  There are a number of policies that were implemented in the recession years that were especially difficult for utilities:

  1. Borrowed or transferred water and sewer monies to avoid raising taxes against falling property values (note that raising taxes on falling values would have yielded a zero sum game, but raising taxes commensurate might have “un”elected a few people
  2. Failing to have long-term financial plan and even fewer have multiyear budgets.  Included are automatic rate adjustments that some are questioning or deferring now, despite having been approved several years ago
  3. Bad investments – public or private.  In either case, if the revenues are not realized, the local entity gains no benefit.  This can include public private infrastructure investments, privatization or investing cash.  Scenarios need to be created to figure out what happens when things don’t go as planned.
  4. Failing to save for a rainy day before the crash.  Our grandparents knew we need to save for a rainy day.  We talk about the lowered level of savings among Americans and the potential issues that could arise if economic difficulties occur.  So exactly why do our elected leaders think it is a great idea not to collect monies in good times for a rainy day?  Other than politics that is?


We have identified four errors in public policy at the local level.  The questions for the 2015 budget are:


  1. Can we repay those funds we “borrowed” from during the down years?
  2. Can we keep the total revenues increasing (may not mean a tax increase, but certainly not a rollback)?
  3. Can we develop realistic scenarios for public investments.  Nothing worse than stranded infrastructure like that $6milion parking garage that grossed under $100 in the last 6 months because no one uses it because there is not business need for it.
  4. Can we develop reserve policies that allow local governments and especially utilities to create and maintain repair and replacement funds, reserves, and “savings” for the next rainy day.  It’s coming.  At some point.
  5. Can we develop a 5 year plan of where the community vision is?

I think this would be a start for a lot of us.


In a prior blog we talked about the difference between urban and rural counties and the impact of the differences between incomes and how that would affect utilities.  Keep in mind that the 40 largest urban counties in the US contain nearly half the US population as do the 50 largest utilities.  So in a recent article in Governing, the focus was on the few counties where income was higher than average.  In fact, in looking at counties, within the top 20 in per capita income are 10 counties in North and South Dakota.  Interesting until you review why.  All are in areas where fracking is ongoing and corporate farming is prevelant.  It is no surprise that the fracking boom has created wealth in rural areas that have limited populations, limited regulations and state and local officials who are desperate to reduce unemployment and stimulate laggard economies.  We noted before that rural counties are often desperate for jobs, so they often ignore what could possibly go wrong when jobs and development are the only priorities for a community.  Governing used the example of Wells County, ND where the per capita income has doubled since 1997 and is 75% above the national average.  Yet the local governments are looking at which roads they will allow to go back to gravel.  How is this possible? 

The issue is not relegated to just Wells, ND.  Despite the fact that many rural communities in areas with intensive farming or fracking have grown 10-15% since 2007, local officials are finding it difficult to raise taxes to pay for infrastructure.  Roads are the most obvious and pressing issue because of the impact from fracking traffic.  As new wells are constructed, the frackers build new dirt roads and use the existing roadways.  Some believe the need to fix many of the roads is temporary so why bother, but it neglects the need to infrastructure improvements in general.  The same argument could be used for water and sewer infrastructure as well, but these wealthy rural communities do not want to increase governmental spending to improve any infrastructure, so the opportunity to address the community needs is being lost.  

What is more interesting is that the states where these rural counties exist, including the Dakotas, along with Montana, Wyoming, New Mexico, and most of the southeastern states are among the states that rely most heavily on federal funding.  So when incomes increase, the dependency remains.  These are the same states that tax residents the least, spend the least on education, have the poorest health care (and the fewest people signed up for the Affordable Care Act and few have state exchanges) and have the most people in poverty.  The dichotomy between reality and the political perception is interesting in these states, which leads one to wonder if the residents of these states like their situation and keep electing representatives that reflect this desire, or they have fallen victim to political interests that cause them to vote consistently against their better interests, or for the interests of a limited few that deny them access to the education, infrastructure, medical care and other benefits their urban and wealthier neighbors enjoy. 

That is a tough question but the bigger question is how to infrastructure agencies like utilities attempt to overcome either of these perceptions?  Neglecting infrastructure, education, medical and the like does not promote local economies, does not create jobs and more likely causes the migration of the best and brightest young people out of the community in search of better prospects, which further imperils their rural situation.  Keep in mind that most cities are relatively permanent, but fracking, like mining, oil and timber before them, have been booms and busts.  The situation if far more dire after the boomtown than it was before.  After all, what could possibly go wrong when 50,000 miners, or frackers, descend upon a community of 1,500 people?  They will consume all the resources, then leave.  Locally those well paying jobs are imported due to the lack of skills and education, and then they leave with the bust.  This has played out many times in the past.  It is not sustainable.  We need to learn from the past – when the boom hits, make the investments you need in infrastructure, education, medicine, etc. so that the future is better after the bust. 


When we ask what the biggest issues facing water and sewer are in the next 20 years, the number one answer is usually getting a handle on failing infrastructure.  Related to infrastructure is sustainability of supplies and revenue needs.  Resolving the infrastructure problem will require money, which means revenues, and overcoming the resistance to fully fund water and sewer system by local officials, the potential for significant costs or shortfalls for small, rural systems and the increasing concern about economically disadvantaged people. 

The US built fantastic infrastructure systems in the mid-20th century that allowed our economy to grow and for us to be productive.  But like all tools and equipment, it degrades, or wears out with time.  Our economy and our way of life requires access to high quality water and waste water. So this will continue to be critical. 

ASCE and USEPA have both noted the deteriorated condition of the water and wastewater systems.  In the US, we used to spend 4% of the gross GNP on infrastructure.  Currently is it 2%.  Based on the needs and spending, there is a clear need to reconstruct system to maintain our way of life.  This decrease in funding comes at a time when ASCE rates water and wastewater system condition as a D+ and estimates over $3 trillion in infrastructure investment will be needed by 2020.  USEPA believes infrastructure funding for water and sewer should be increased by over $500 billion per year versus the proposed federal decrease of similar amounts or more. 

Keep in mind much of what has made the US a major economic force in the middle 20th century is the same infrastructure we are using today. Clearly there is research to indicate there is greater need to invest in infrastructure while the politicians move the other way.  The public, caught in the middle, hears the two sides and prefers less to pay on their bills, so sides with the politicians as opposed to the data.  Make no mistake, our way of life results from extensive, highly efficient and economic infrastructure systems. 

In many ways we are victims of our own success.  The systems have run so well, the public takes them for granted.  It is hard to make the public understand that our cities are sitting on crumbling systems that have suffered from lack of adequate funding to consistently maintain and upgrade.  Public agencies are almost always reactive, as opposed to pro-active, which is why we continuously end up in defensive positions and at the lower end of the spending priorities. So we keep deferring needed maintenance. The life cycle analysis concepts used in business would help. A 20 year old truck, pump, backhoe, etc. just aren’t cost effective to operate and maintain.

Another part this problem is that people have grown used to the fact that water is abundant, cheap, and safe. Open the tap and here it comes; flush the toilet and there it goes, without a thought as to what is involved to produce, treat and distribute potable water as well as to collect, treat, and discharge wastewater.

Water and Sewer utilities are being funded at less than half the level needed to meet the 30 year demands.  Meanwhile relying on the federal government, which is trying to reduce funding for infrastructure for local utilities is not a good plan either. We need education, research and demonstrations to show those that control funding of the needs. The education many be the toughest part because making the those that control funding agree to increase rates carries a potential risk to them personally.  But there are no statues to those that don’t raise rates – only those with vision.  We need to instill vision in our decision-makers.


In the last blog I talked about the challenge to rural utilities, many of which serve relatively few people and have used federal monies to pay for a lot of their infrastructure.  In this blog we will take a look at the trends for community water systems which are defined as systems that serve at least 15 service connections or serve an average of at least 25 people for at least 60 days a year. EPA breaks the size of systems down as follows:

  • Very Small water systems serve 25-500 people
  • Small water systems serve 501-3,300 people
  • Medium water systems serve 3,301-10,000 people
  • Large water systems serve 10,001-100,000 people
  • Very Large water systems serve 100,001+ people

Now let’s take a look at the breakdown (from NRC 1997).  In 1960, there were about 19,000 community water utilities in the US according to a National Research Council report published in 1997.  80% of the US population was served.  in 1963 there were approximately 16,700 water systems serving communities with populations of fewer than 10,000; by 1993 this number had more than tripled—to 54,200 such systems. Approximately 1,000 new small community water systems are formed each year (EPA, 1995). In 2007 there were over 52,000 community water systems according to EPA, and by 2010 the number was 54,000.  85% of the population is served. So the growth is in those small systems with incidental increases in the total number of people served (although the full numbers are more significant). 


TABLE 1 – U.S. Community Water Systems: Size Distribution and Population Served


Number of Community Systems Serving This Size Community a

Total Number of U.S. Residents Served by Systems This Size b>

Population Served

1963

1993

1963

1993

Under 500

5,433 (28%)

35,598 (62%)

1,725,000 (1%)

5,534,000 (2%)

501-10,000

11,308 (59%)

18,573 (32%)

27,322,000 (18%)

44,579,000 (19%)

More than 10,000

2,495 (13%)

3,390 (6%)

121,555,000 (81%)

192,566,000 (79%)

Total

19,236

57,561

150,602,000

242,679,000

a Percentage indicates the fraction of total U.S. community water supply systems in this category.

b Percentage is relative to the total population served by community water systems, which is less than the size of the U.S. population as a whole.

SOURCES: EPA, 1994; Public Health Service, 1965.


Updating these numbers, there are over 54,000 systems in the US, and growth is almost exclusively in the very small sector.  93% are considered to be small or very small systems—serving fewer than 10,000 people. Even though these small systems are numerous, they serve only a small fraction of the population. Very small systems, those that serve 3,300 people or fewer make up 84 percent of systems, yet serve 10 percent of the population.  Most critical is the 30,000 new very small systems that serve only 5 million people (averaging 170 per system).  In contrast, the very large systems currently serve 45% of the population.  Large plus very large make it 80%.  The 800 largest systems (1.6%) serve more than 56 percent of the population. 900 new systems were added, but large systems served an additional 90 million people.

What this information suggests if that the large and very large sector has the ability to raise funds to deal with infrastructure needs (as they have historically), but that there may be a significant issue for smaller, rural system that have grown up with federal funds over the past 50 years.  As these system start to come to the end of their useful life, rural customers are in for a significant rate shock. Pipeline average $100 per foot to install.  In and urban area with say, 60 ft lots, that is $3000/household.  In rural communities, the residents may be far more spread out.  As an example, a system I am familiar with in the Carolinas, a two mile loop served 100 houses.  That is a $1.05 million pipeline for 100 hours or $10,500 per house.  With dwindling federal funds, rural customers, who are already making 20% less than their urban counterparts, and who are used to very low rates, that generally do not account for replacement funding, will find major sticker shock. 

This large number of relatively small utilities may not have the operating expertise, financial and technological capability or economies of scale to provide services or raise capital to upgrade or maintain their infrastructure.  Keep in mind that small systems have less resources and less available expertise.  In contrast the record of large and very large utilities, EPA reports that 3.5 percent of all U.S. community water systems violated Safe Drinking Water Act microbiological standards one or more times between October 1992 and January 1995, and 1.3 percent violated chemical standards, according to data from the U.S. Environmental Protection Agency (EPA).. 

EPA and professionals have long argued that centralized infrastructure for water and sewer utilities makes sense form an economy of scale perspective.  Centralized drinking water supply infrastructure in the United States consists dams, wells, treatment plants, reservoirs, tanks, pumps and 2 million miles of pipe and appurtenances.   In total this infrastructure asset value is in the multi-trillion dollar range.  Likewise centralized sanitation infrastructure in the U.S. consists of 1.2 million miles of sewers and 22 million manholes, along with pump stations, treatment plants and disposal solutions in 16,024 systems.  It is difficult to build small reservoirs, dams, and treatment plants as they each cast far more per gallon to construct than larger systems.  Likewise operations, despite the allowance to have less on-site supervision, is far less per thousand gallons for large utilities when compared to small ones.  The following data shows that the economy-of-scale argument is true:

  • For water treatment, water distribution, sewer collection and wastewater treatment, the graphics clearly demonstrated the economy-of-scale of the larger utility operations versus small scale operations (see Figures 2-5). 
  • The administrative costs as a percentage of the.total budget parameter also demonstrated the economy-of-scale argument that larger utilities can perform tasks at a lesser cost per unit than the smaller utilities (see Figure 6).

Having reviewed the operations costs, the next step was to review the existing rates.  Given the economy-of-scale apparent in Figures 2 to 6, it was expected that there would be a tendency for smaller system to have higher rates.  Figures 2-6 demonstrate this phenomena. 

So what to do?  This is the challenge.  Rate hikes are the first issue, a tough sell in areas generally opposed to increases in taxes, rates and charges and who use voting to impose their desires.  Consolidation is anothe5r answer, but this is on contrast to the independent nature of many rural communities.  Onslow County, NC  figured out this was the only way to serve people efficiently 10 years ago, but it is a rougher sell in many, more rural communities.  Infrastructure banks might help, the question is who will create them and will the small system be able to afford to access them.  Commercial financing will be difficult because there is simply not enough income to offset the risk.  The key is to start planning now for the coming issue and realize that water is more valuable than your iPhone, internet, and cable tv.  In most cases we pay more for each of them than water (see Figure 7).  There is something wrong with that…

 Image


Figure 1  Breakdown of Size of Systems

Image


Fig 2 Cost of Water Treatment

Image


Fig 3 Cost of Water Distribution

Image


Fig 4 Cost of Sewer Collection

Image


Fig 5 Cost of Sewer Treatment

Image

Fig 6 Cost of Administration as a percent of total budget


Image

FIgure 7 Water vs other utilities


%d bloggers like this: