Broward Center. Can’t wait!!
Hamilton tonight!!
Leave a comment

Broward Center. Can’t wait!!
May we have a change in our tone toward each other, a reduction in the hate, peace in the world, happiness everywhere and goodwill to all!


This is a good time to talk a little economics. I brought up the Laffer curve last week. LEt’s see what a little research can do.
The federal government has two very misunderstood issues. First, while the federal budget has increased with time, the number of employees has actually fallen. The reason, aside form spending for Medicare and social security, is that most of the work is actually contracted to the private sector. Hence federal spending spurs the private economy and the GDP of the country. That appears to be the case as reported by leading economists for the past year. So as an experiment, let’s look at the economy (as measured by GDP), the tax rates, and tax collections rom income tax as a means to see how well “trickle down economics” works. The first ask is the data- the data to use is GDP (nominal and real, highest income tax rate, income tax and total federal receipts, and inflation by year). The federal government publishes this data from 1934 to date (2017 is the last complete year). The next step is graphing.

Figure 1 – Top Income Tax rate 1934 to date
Next, let’s take a look at the GDP with time – There is a lot of ups and downs, although they appear to have been somewhat attenuated as the Federal Reserve exercised more control over the monetary supply and policy. The overall growth rate is decreasing with time.
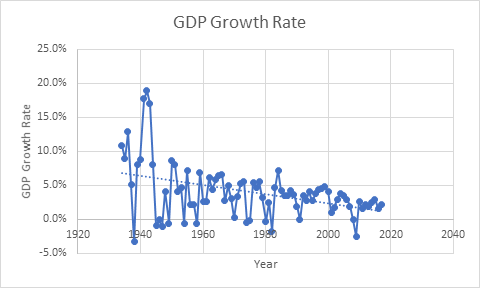
Figure 2 – Change in GDP with time.
Next, let’s look at a map of the income tax rate for the highest bracket. It is easy to see that this rate has been as high as 91% and that there is some correlation in the graph with higher tax rates and a stronger economic growth.

Figure 3 – comparison of top tax rate and the increase in GDP 1934-date
The years versus the percent of GDP that is personal income tax is outlines in the next graph. There are downward spikes that occur. There are spikes up and down, and although a little hard to see, what you can see is that 1963, 1982, 1989, 2002 and 2008 were all years when the growth rate dropped. It should be noted that those were all years when the tax rates were decreased by Congress and the President. There were prior drops that were related to other issues in 1970-76.
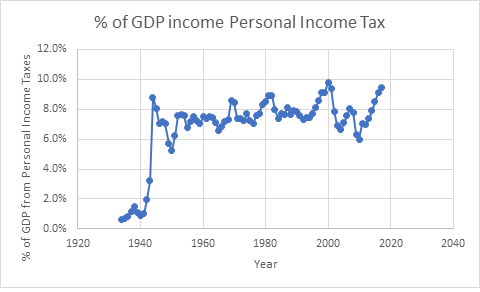
Figure 4 – Change in GDP compared to % of GDP that is personal income tax collections
However, overall, the trend in personal income tax receipts is climbing, except after tax cuts in 2001 and as a result of the 2008 fiscal and banking crisis.
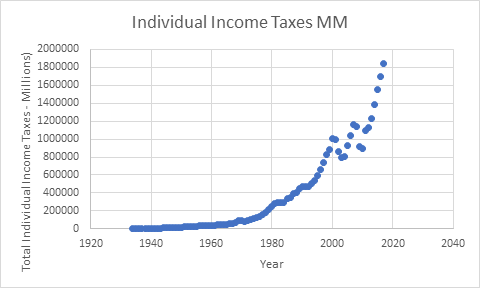
Figure 5 – total personal income tax collections with time
The compares the growth in GDP with the percent of taxes raised by federal income taxes as a percent of GDP. There are two arguments to a result – lower taxes mean sore GDP due to private investing, or lower taxes means less tax revenue with little impact on the GDP. There is a slight trend in this analysis for lower percent of taxes and higher rate of GDP growth, but that is still not the argument made by Laffer.
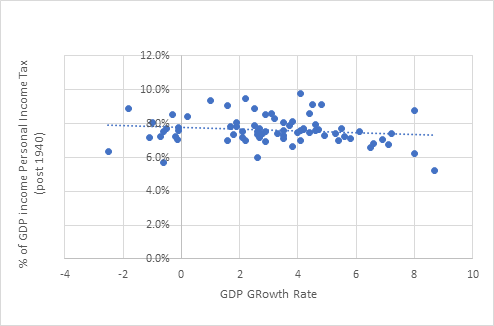
Figure 6 – Comparison of GDP Growth Rate to Personal Income Tax collections as a percent of GDP
Next is a graph of the percent of GDP that is personal income tax receipts as a percentage of GDP versus the maximum income tax rate (post 1940). The graph shows that the percent of GDP that is personal income taxes decreases slightly as the tax rate climbs, which seems to support Laffer and the Trickle-down arguments. But their question really is this – do lower tax rates spur spending. For that we need a final graph.
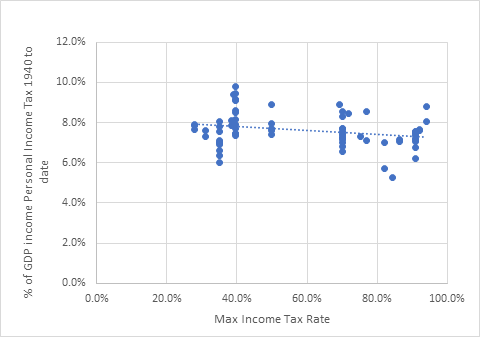
Figure 7 – Maximum Tax Rate to Personal Income Tax collections as a percent of GDP
The argument is that the income tax rate impacts the GDP. Laffer’s argument for lower tax rates was that there would be more taxes (perhaps a slight trend, excluding all other data) and that the economy would boom due to investment by the private sector (trickle down economics). If so, the salient data analysis should be that there is a major increase in GDP as tax rates are lowered from the highest levels. However, the facts disprove this argument – there is a tendency for the overall GDP to increase when the tax rates are highest – exactly the opposite of what the trickle down political pundits in Washington tell you. In fact, higher tax rates and higher GDP are correlated. Figure 8 shows this quite clearly. So should taxes be higher? Maybe – at least if we want to balance the budget in some manner. Clinton seemed to find the right point when the economy boomed in the late 1990s – tax collections increased and the budget was balanced, but the argument that tax rates impact the economy are not as simplistic as argued in Washington. In contrast, it does appear that tax cuts appear to negatively impact both the economy and tax revenues – something not unexpected but largely ignored by the Trickle-down crowd.


Figure 8 Comparison of Maximum Tax Rate to Growth in GDP (Laffer’s Graph) vs the Laffer Curve – the Laffer curve is clearly not correct compared to the actual data
On the other hand, there is a very strong relationship between population growth and the GDP – are argument long made by economists is that the economy can only ultimately increase due to population growth or economic efficiencies (automation). So maybe the answer is to let more people into the US – maybe that will increase the economy, assuming they make enough to pay taxes (47% of Americans do not earn enough to pay anything other than Social security and Medicare taxes which the wealthy largely do not pay). Politically this creates a lot for local officials to think about. Regionally, there are significant social and societal implications. Where large portions of the population do not able to pay taxes, that means challenges for paying for local infrastructure.

Figure 9 – Population increase vs GDP Growth Rate
In the prior blog I brought up the issue of the recent tax cuts to corporations and the wealthy. The argument for this to stimulate the economy is based on the Laffer curve that was seized upon by Jack Kemp and others during Reagan’s administration. It was termed supply side economics. The argument goes like this – if rick people keep more money, they will invest which will increase jobs and therefore increase wages for everyone else. The economy will grow at such a rate that the tax cuts will pay for themselves. Ok, I agree that people can be overtaxed, but the reality is that while this economic theory continues to be discussed by academics, it has NEVER worked in reality. Ever. And the reason why is obvious. While the wealthy will invest, there is no guarantee that those jobs will be in the US. In fact, over the last 35 years when this economic policy has been used, the jobs increase faster overseas. The reason is obvious – and we only have to look at Henry Ford to figure out why. Major corporations are global. They sell all over the world. They sell where the market is not saturated with goods. That is not the situation in the US. We are pretty saturated and have been since the 1970s. The market is overseas, but they cannot buy the products we sell. So adopting the Henry Ford model, we have them build the goods, pay them a decent salary so they can buy the products they make, while keeping costs down so the corporation increases the number of goods sold, and the amount of profits sent to shareholders (the rick investors). That leave out the people in the US, which is why this economic model is doomed to fail. It also ignores what is the likely real challenge behind stagflation in the US in the 1970s. The market was saturated with good in the US and Europe. Nixon saw this on opened China. Carter expanded those relations. There are 1,2 billion Chinese – big, untapped market, but we need to build goods there to allow them to buy them. That means hire Chinese workers. Worked in japan. Worked in Germany after WWII. There was an economic lesson, but we missed. It.

Now back to the Laffer curve. What Art Laffer argued was that there was an optimum tax rate – if it was too low not enough m revenue was generated, while if too high people would be less encouraged to invest and reap profits for tax reasons. Kemp and company seized on the tax rates being to high as a means to create political capital with the public while never contemplating the potential reality that reducing taxes would increase revenues. But they never evaluated whether that was true. And they were wrong. We were not of the wrong side (see Laffer curve). We never reached it. And they ignored the fact that the tax rates on the super wealthy were 90% before 1964. Certainly that did not inhibit economic growth. The Post WWII was one of out great growth periods, not one of strife. The economy expended. And there may be a reason why. Taxes are only paid when investments are sold, not when they are held. Hence if tax rates are high, investments are helped. That creates stability for companies and lessens challenges by corporate raiders. Hence perhaps this tax policy has confounded the tax collection problem and adversely impacts the stability of corporate jobs and production of goods. An area than needs a lot more study….
The stock market continues to rise, or at least is was, but the economy continues to grow. Retail estate values are still rising in growth areas. Interest rates are still low. Unemployment is nearing historic lows. Life and the economy is great. What is there to be concerned about? Well, listen to the whispers. Certain people want it to grow fast, but we have been there before. There are three things out there you can here. First, Bull cycles have a lifespan. They rarely last more than 10 years without a negative (Bear) correction. We have had 10 years of continuous growth since 2009. Many complain the recovery was not fast enough, but the steady recovery may be extending its run. Bulls have reigned for 50 or the last 61 years – 84%. but those intermittent bears have claimed half the gains from the Bulls each time. Think 2008 when the Great Recession claimed half the wealth accumulated in your 401K and house. At some point the Bulls will strike again.
The real estate market, while not at levels seen in the past in most areas, has priced most people out of the market in some urban areas (southeast Florida for example). That portends poorly for working, middle class people who do the bulk of the work and pay the bulk of the taxes in this country. 47% of people do not pay any income taxes – because they do not earn enough to do so!. They still pay social security and medicare taxes (which rich people and investors do not). If labor is priced out, they cannot afford to live there. However, given the low unemployment, workers may have leverage to increase wages – which will lead to either inflation measures or less profits. Both can be negatives for the economy.
Finally if the economy tanks, property values will fall, unemployment will increase and the already questionable tax policy of the federal tax cut will be amplified. For all the rhetoric amongst those in Congress (on both sides) about deficits, only Bill Clinton was able to balance the budget (largely on the back of the Bush 1 tax increases, plus a few of his own). The Bush 2 tax cuts created immediate deficits and the economic crash in 2008 forced Congress to increase the deficits to avoid global meltdown that would have exceeded what we experienced. Some economists are concern – a high growth economy cannot continue indefinitely. If the economy falters, you want to be prepared. Are we? Are local governments and utilities? I think most of us are still digging out of 2008.
