Check out today’s Sun Sentinel. FL Legislature looking to cut $1 billion in tax revenues. So much for saving for a rainy day!
Check out today…
Leave a comment

Check out today’s Sun Sentinel. FL Legislature looking to cut $1 billion in tax revenues. So much for saving for a rainy day!
We have spent some time talking about the need to fund and maintain reserves. I think most people reading this concur but how do you track reserves? Every public sector utility gets audited annually. How many people have actually looked at that audit? Or attend the discussion with the elected officials with the auditors. Or know how to read it? This is an important part of our job. We need to defend the utility and knowing the financial position is part of the defense.
The annual audit is commonly called the Comprehensive Annual Financial Report of CAFR. The finance director normally controls the process. The CAFR is many, many pages long and include information on revenues and expenses, but also a bunch of other things like assets, depreciated assets, transfers to other funds, outstanding long and short term debt, fund balance and reserves. The CAFR is designed to be a management tool to help with tracking performance of the entity with time. CAFRs were redesigned by the Governmental Accounting Standards Board (GASB) about 15 years ago to provide more useful information to lenders and oversight agencies. It was redesigned to help with management, discussion and analysis of the financial position. The utility director should be a part of this management, discussion and analysis team and should fully understand its contents as it affects the utility. The CAFR should not be viewed simply as a compliance tool to submit and forget about.
For example, the assets should include the value of all installed infrastructure (fixed) and all mobile equipment (non-fixed) as assets. The depreciation is the total amount of depreciation, assigned as a straight line, since the acquisition of the assets. You should always have more than 50% of the asset value remaining. You should understand outstanding debt and debt plus depreciation should be less than your asset values, otherwise you are underwater with your assets. You should understand the transfers to other funds and the justification for same.
But the reserves are key. Some of these reserves may be restricted, which means they are likely impact fees, reserves to cover debt coverage requirements or covenants for repair and replacement of other purposes. Most utilities do not have a separate repair and replacement reserve, but this would be useful for those capital expenses, Likewise, operating reserves, for use to balance the budget in lean periods should be identified. The reporting reserves for rate stabilization should be separate from the operating reserves (usually 1.5 to 3 months) to cover the day-to-day expenses. An understanding of the value and tracking of these reserves is useful to long and short term decision making by utility managers. Unfortunately most auditors and most finance director do not make separate reserves and tracking becomes a challenge. But the utility is an operating entity. Finance, like purchasing and human resources and support agencies designed to provide service to help accomplish the mission of the operating elements of the utility. You need the support agencies to provide the necessary information to help your decision-making. Doubtful your finance director wants to hear this, but really, does the utility operate because the finance department does the work or because the utility does? Just food for though.

As water and sewer utilities, the public health and safety of our customers is our priority – it is both a legal and moral responsibility. The economic stability and growth of our community depends on reliable services or high quality. The priority is not the same with private business. Private businesses have a fiduciary responsibility to their stockholders, so cutting services will always be preferred to cutting profits. Therein lies the difference and yet the approach is different. Many corporations retain reserves for stability and investment and to protect profits. Many governments retain inadequate reserves which compromises their ability to be stable and protect the public health and safety. Unlike corporations, for government and utilities, expenses are more difficult to change without impacting services that someone is using or expects to use or endangering public health. Our recent economic backdrop indicates that we cannot assume income will increase so we need to reconsider options in dealing with income (revenue) fluctuations. If there are no reserves, when times are lean or economic disruptions occur (and they do regularly), finding funds to make up the difference is a problem. The credit market for governments is not nearly as “easy” to access as it is for people in part because the exposure is much greater. If they can borrow, the rates may be high, meaning greater costs to repay. Reserves are one option, but reserves are a one-time expense and cannot be repeated indefinitely. So if your reserves are not very large, the subsequent years require either raising taxes/rates or cutting costs. An example of the problem is illustrated in Figure 1. In this example the revenues took a big hit in 2009 as a result of the downturn in the economy. Note it has yet to fully return to prior levels as in many utilities. This system had accumulated $5.2 million in reserves form 2000-2008, but has a $5.5 million deficit there after. Reserves only go so far. Eventually the revenues will need to be raised, but the rate shock is far less if you have prudently planned with reserves. You don’t get elected raising rates, but you have a moral responsibility to do so to insure system stability and protection of the public health. So home much is enough for healthy reserves? That is a far more difficult question. In the past 1.5 months of operating reserves was a minimum, and 3 or more months was more common. However, the 2008-2011 economic times should change the model significantly. Many local governments and utilities saw significant revenue drops. Property tax decreases of 50% were not uncommon. It might take 5 to 10 years for those property values to rebound so a ten year need might be required. Sales taxes dropped 30 percent, but those typically bounce back more quickly - 3-5 years. Water and sewer utilities saw decreases of 10-30%, or perhaps more in some tourist destinations. Those revenues may take 3-5 years to rebound as well. Moving money from the utility to the general fund, hampers the situation further. Analysis of the situation, while utility (government) specific, indicates that appropriate reserves to help weather the economic downturns could be years as opposed to months. The conclusion is that governments and utilities should follow the model of trying to stabilize their expenses. Collect reserves. Use them in lean times. Develop a tool to determine the appropriate amounts. Educate local decision-makers and the public. Develop a financial plan that accounts for uncertainty and extreme events that might impact their long-term stability. Take advantage of opportunities and most of all be ready for next time. In other words, plan for that rainy day.
My last blog was a discussion about surpluses. The State of Florida will have a $1.3 billion surplus this year and a host of politically expedient answers for where that money goes (tax cuts, pork projects, projects to help election results), but little mention of replenishing trust funds and reserves that were emptied to balance the budget amid tax cuts from 2010 – 2012. But perhaps it is not the legislators or their constituents that we should blame for not understanding the need for reserves because the truth is that most people are not used to saving. A recent article I read noted that 72 percent of Americans live paycheck to paycheck and would have difficulty putting $2000 together if needed. $2000 is not a lot of money these days – it won’t buy you a transmission for example or a new engine for your car. It won’t cover first, last and a deposit on a rental. And it won’t cover the down payment on a house or most cars. There are people who do not receive enough income to achieve some degree of savings, but not 72% of us. We have come to perceive that having little savings is normal, but it wasn’t always this way and it is not this way everywhere in the world. Back in the day, American saved more than they do now. The reason is not that they had more money (they didn’t) or that they had less to spend money on (as things cost more proportionately). But it was that “rainy day” they all knew would come and when they would need money. They had been through depressions, recession and losses of industries (remember those Concord coachmakers did not get a federal bailout in trying to compete with Henry Ford). They knew that there would be times when they needed to rely on themselves to survive and savings was the key.
There are two major differences from the past. The most important is the fact is that credit was a lot harder to come by back in the day, so you needed cash for those big purchases. That has changed dramatically in 50 years. Today we get advertisements for credit cards – in the mail, instant credit at stores, easy credit for cars, and in the early 2000s, no-money-down-no-income-verification loans on real estate. The need to save evaporated. The access to easy credit has eliminated much of the need to save for those big expenses. We can borrow to acquire them. If we have a job problem, we borrow against the house or life insurance policy. These are good backstops that help us maintain our way of life.
At the same time as we are being extended opportunities to secure funds to spend, we are barraged by advertisements and flyers and pitches to spend that money on products and services, many of which we probably don’t need, but are “cool” to have. We are encouraged to compete to have better “stuff” than the other guy, and make sure we have the newest technology. We all do it. Just look at all phones can do, while keeping in mind that the old Bell phone I bought in college still works regardless of the situation and still sounds good. No cool ringtones however, nor photo capability. All that means we spend less on “needs” and more on “stuff.”
Given this backdrop it is no surprise the attitude of decision-makers in government toward revenues and expenses. Re-education of the public is needed as opposed to rhetoric. We need to move the public discussion away from the concept of a balanced budget being expenses equal revenues to the correct concept of revenues + reserve expenses = expenses plus savings. At times you use reserves (and savings =0) while other times reserve expenses are 0, while savings are positive. When big expenses come, borrow, but recurring expenses should not be funded through borrowing (credit). We should seek to avoid is the desire to cut taxes (akin to cutting our salaries) to bring the budget back into balance that if we run a surplus, or spend it on “stuff.” Such a system leaves room for those lean times when revenues may fluctuate but expenses do not (or increase).
It was not so long ago that we were talking about local and state governments suffering major shortfalls in their revenues as a result of the downturn in the economy. Cuts were being made to police, fire, education and parks. Politicians were fussing over the need to cut taxes and cut government expenditures in the process. Employees lost jobs and benefits were cut. In a prior blog we discussed the fact that economic upticks and downturns were cyclical, and unlike people, there is a tendency for local and state government policy makers to “hang with the curve” so to speak and have government expenses track the economy as opposed to try to stabilize spending by taking advantage of the ups to create reserves in order to take advantage of the downs. They ignore the old adage that their grandparents told them – save for a rainy day. And we don’t recognize those rainy days approaching! It is not a lot different unfortunately than many citizens who spend when they have money, and are short when they don’t. We are not a country of savers and it hurts us often.
There is however a major benefit for government to have reserves. When government has reserves, it can take advantage of lower competition to construct or invest in infrastructure in lean times. There are many examples of governments getting construction done at discounted rates based on timing their projects to economic downturns. A side benefit is that those governments are spending money at the time when they need to keep people employed. FDR did this during the Great Depression. Obama attempted to copy him in 2009 with the AARA monies. In both cases they may not have invested enough, but both were faced with deficits on the federal level and a Congress that was reluctant to spend.
The economy has rebounded and state and local governments are starting to run surpluses. The South Florida Sun-Sentinel recently reported that the big “challenge” for the Florida Legislature and many other state and local governments, is they are running surpluses. Recall the last time the federal government ran a surplus, we got tax cuts that immediately put the feds back in the red because they had not built up any reserves, and won’t even with a balanced budget anytime soon. Well Florida has $1.3 billion extra on hand and guess what we hear in this election year – tax cuts, more money for special projects, extended sales tax exemption dates, etc. Those running for office are thrilled with the surplus because it helps their platform but we hear nothing about restocking the trust funds that were raided during the 2009, 2010 and to some extent the 2011 budgets!
Expect this to be the norm, and the rhetoric should be troubling to fiscally responsible people. If we have surpluses, times must be better. In good times we should be encouraging decision-makers to sock money away in reserves, savings and other solid investments, and at the same time restocking those accounts drained to pay the bills during the down time of the Great Recession. In Florida, our highway trust fund, environmental trust funds and education funds were drained. They have not been restocked. In fact the cuts to most of those programs has not been restored either. The next economic downturn will come – will we be prepared to weather storm by spending our savings as opposed to cutting services which magnifies the impact of residents?
As times get better, utilities owned by local governments should pay particular attention to General Fund revenues. Many of those General Funds increased contributions from the water and sewer funds to make up the difference in losses of property and sales tax dollars. That prevented utilities from making investments, or forced them to borrow money to cover investments that might otherwise have been paid for in cash. Time for the General Fund to pay the utility back! Time to restock the reserves and time to spend money to catch-up with the deferred maintenance and capital. Of course the costs are not what they were 3 or 4 years ago, and neither are the interest rates, so we all pay more for the same projects because we could not spend the reserves in the down period.
Utilities should always have significant reserves. Nothing we do is inexpensive, so having reserves makes it possible to fix things that inevitably go wrong. Reserves are a part of a well operated, fiscally sound utility. Taking money from the utility during down times hurts both the utility and the local government. Total reserves diminish of the entity, making it less possible to deal with emergencies, cover the loss of revenues, or take advantage of lower costs for construction projects. Meanwhile, creating reserves and a pay-as-you-go system for ongoing replacement of pipes and pumps is good business. It insures that ongoing money is spent to prevent deterioration of the utility system. The reserves allow for accelerated expenditures when times are tough, prices are down and people need work. When utilities spend money, it translates to local jobs. But the only way to do this is make convincing argument of the benefits of reserves and spending.
It’s groundhog day and Super Bowl Sunday! The groundhog saw his shadow indicating 6 more weeks of winter, but you wouldn’t know it at the Super Bowl. The bright lights are on in New Jersey with over 80,000 fans braving the cool, but no the harsh cold weather of last weekend. Just like the groundhog this morning, millions will be watching. The Super Bowl is biggest one day sporting event in the world with over 100 million viewers watching it live in the US, and over a billion around the world. And we all enjoy the commercials too, but it speaks to our priorities when a 30 second commercial will cost $4 million. A lot of utilities could do a lot with $4 million. Just saying….
I have said before in this blog that my Dad’s family were born and raised in Detroit – not the suburbs, in the City, about a mile north of Tiger Stadium. My great-grandfather was a butcher. His sons all became butchers, so my Dad grew up around the butcher shop as a kid. It was the Depression, but because of the shop, my Dad had food on his table. My Great-grandmother managed the money, and acquired a number of properties in the area of 13th and Magnolia that the sons, and extended families would eventually move to. It was a solution to the difficulties outside the shop. Family was the means to survive the hard times of the Depression.
Of course Detroit was a booming city – over 100 auto companies were in Detroit at the turn of the last century, and the City was becoming the center of a new mode of transportation – the automobile. Henry Ford developed the assembly line to allow everyone to own a car, furthering the status of the City. As the twenties developed, Detroit and Chicago competed to become the “jewel” of the Midwest. Elaborate stone buildings, expanding infrastructure for roads, trains, water, sewer and storm water were all centerpieces of pride in the City. Employment and incomes were high, worker benefits were good, the workforce was highly skilled and education was good. Profits were good and the auto industry was Detroit-centric. Detroit was a vibrant City in the first 50 years of the last century.
Scroll ahead 60 years and how the city has fallen. The City has lost a million people. It has $18 billion in debt, and is collecting $0.3 billion less in revenues since 2008. The tax base has been decimated. Houses can be purchased for minimal prices. Churches have been abandoned. Crime is high. Employment is down, unemployment remains above the state and national average. Poverty is up, incomes are down. Huge areas must be served but serve no one or only a very few. The City filed the highest profile bankruptcy for a municipality ever.
The television show Low Down Sun last summer provided a graphic look at the City – blocks of the City devoid or mostly so of housing or other buildings, schools no longer in use, roads in disrepair, classic stone buildings with the windows broken out. You can see what the City was, and the haunting view of the City today are a stark reality. To add insult to injury, the Sun-Sentinel wrote a recent article about how people are making money doing tours of abandoned buildings in Detroit, or how farming is occurring in the City limits.
So if Detroit failed, why not Cleveland, Akron, Pittsburgh, St. Louis, Cincinnati or virtually any other large, older Midwestern industrial city? Sadly many of these cities have lost the industries that made them famous and provided jobs and a stable tax base and incomes. Many of these cities are also stressed, much as we found Birmingham was. There are many arguments for what precipitated these losses: unions, shifts in population, outsourcing offshore, competition within the US, changes in consumer preferences, technology…… the list goes on. But the reality is it doesn’t matter why, the City must deal with the reality that is. We all look at Detroit and its recent bankruptcy filings. Maybe looking at Detroit allows us to feel better about our situations, but we need to learn the lesson from Detroit, Birmingham, Cleveland and others who filed for bankruptcy. We need to look back to determine where the decisions were that created the issues. Was it expanding to fast, poor economic assumptions, failure to manage finances better, political failures, failure to raise revenues/taxes/water fees, or failure to maintain or replace infrastructure? Rarely is it corruption, so it is people trying to do well but failing in their jobs. The question is why?
I would start with training. We need to train our public managers better, but MPA and MBA schools are not teaching about these failures. In part it may be because we tend to teach positive lessons, versus negative ones, but they would be useful case study of the potential challenges. In a prior blog I noted that the biggest challenge for government managers is managing in lean times. Often lean times can be overcome by saving money as fund balances and investing (well), but long-term downturns like Detroit, Cleveland and other cities have experienced cannot be corrected this way. There are major policy implications that must be overcome.
From a utility perspective it is important to note that the economic difficulties are not limited to cities and counties but utilities are subject to long-term declines as well. The problem is particularly acute in industrial communities where a large industry (think mills in the mid-Atlantic states) move away and leave water and wastewater facilities at far less capacity than they were designed for. Small systems may be especially at risk.
As an industry we need to learn from these failures. We should study the difficult times to determine how the problems can be avoided. The need to figure out how to manage funds better, deal with customer losses, and define strategies to overcome losses. If anyone has some thoughts, please respond to the blog, but doesn’t this sound like a research project in the making?
When we ask what the biggest issues facing water and sewer are in the next 20 years, the number one answer is usually getting a handle on failing infrastructure. Related to infrastructure is sustainability of supplies and revenue needs. Resolving the infrastructure problem will require money, which means revenues, and overcoming the resistance to fully fund water and sewer system by local officials, the potential for significant costs or shortfalls for small, rural systems and the increasing concern about economically disadvantaged people.
The US built fantastic infrastructure systems in the mid-20th century that allowed our economy to grow and for us to be productive. But like all tools and equipment, it degrades, or wears out with time. Our economy and our way of life requires access to high quality water and waste water. So this will continue to be critical.
ASCE and USEPA have both noted the deteriorated condition of the water and wastewater systems. In the US, we used to spend 4% of the gross GNP on infrastructure. Currently is it 2%. Based on the needs and spending, there is a clear need to reconstruct system to maintain our way of life. This decrease in funding comes at a time when ASCE rates water and wastewater system condition as a D+ and estimates over $3 trillion in infrastructure investment will be needed by 2020. USEPA believes infrastructure funding for water and sewer should be increased by over $500 billion per year versus the proposed federal decrease of similar amounts or more.
Keep in mind much of what has made the US a major economic force in the middle 20th century is the same infrastructure we are using today. Clearly there is research to indicate there is greater need to invest in infrastructure while the politicians move the other way. The public, caught in the middle, hears the two sides and prefers less to pay on their bills, so sides with the politicians as opposed to the data. Make no mistake, our way of life results from extensive, highly efficient and economic infrastructure systems.
In many ways we are victims of our own success. The systems have run so well, the public takes them for granted. It is hard to make the public understand that our cities are sitting on crumbling systems that have suffered from lack of adequate funding to consistently maintain and upgrade. Public agencies are almost always reactive, as opposed to pro-active, which is why we continuously end up in defensive positions and at the lower end of the spending priorities. So we keep deferring needed maintenance. The life cycle analysis concepts used in business would help. A 20 year old truck, pump, backhoe, etc. just aren’t cost effective to operate and maintain.
Another part this problem is that people have grown used to the fact that water is abundant, cheap, and safe. Open the tap and here it comes; flush the toilet and there it goes, without a thought as to what is involved to produce, treat and distribute potable water as well as to collect, treat, and discharge wastewater.
Water and Sewer utilities are being funded at less than half the level needed to meet the 30 year demands. Meanwhile relying on the federal government, which is trying to reduce funding for infrastructure for local utilities is not a good plan either. We need education, research and demonstrations to show those that control funding of the needs. The education many be the toughest part because making the those that control funding agree to increase rates carries a potential risk to them personally. But there are no statues to those that don’t raise rates – only those with vision. We need to instill vision in our decision-makers.
In the last blog I talked about the challenge to rural utilities, many of which serve relatively few people and have used federal monies to pay for a lot of their infrastructure. In this blog we will take a look at the trends for community water systems which are defined as systems that serve at least 15 service connections or serve an average of at least 25 people for at least 60 days a year. EPA breaks the size of systems down as follows:
Now let’s take a look at the breakdown (from NRC 1997). In 1960, there were about 19,000 community water utilities in the US according to a National Research Council report published in 1997. 80% of the US population was served. in 1963 there were approximately 16,700 water systems serving communities with populations of fewer than 10,000; by 1993 this number had more than tripled—to 54,200 such systems. Approximately 1,000 new small community water systems are formed each year (EPA, 1995). In 2007 there were over 52,000 community water systems according to EPA, and by 2010 the number was 54,000. 85% of the population is served. So the growth is in those small systems with incidental increases in the total number of people served (although the full numbers are more significant).
TABLE 1 – U.S. Community Water Systems: Size Distribution and Population Served
|
|
Number of Community Systems Serving This Size Community a |
Total Number of U.S. Residents Served by Systems This Size b> |
||
|
Population Served |
1963 |
1993 |
1963 |
1993 |
|
Under 500 |
5,433 (28%) |
35,598 (62%) |
1,725,000 (1%) |
5,534,000 (2%) |
|
501-10,000 |
11,308 (59%) |
18,573 (32%) |
27,322,000 (18%) |
44,579,000 (19%) |
|
More than 10,000 |
2,495 (13%) |
3,390 (6%) |
121,555,000 (81%) |
192,566,000 (79%) |
|
Total |
19,236 |
57,561 |
150,602,000 |
242,679,000 |
|
a Percentage indicates the fraction of total U.S. community water supply systems in this category. b Percentage is relative to the total population served by community water systems, which is less than the size of the U.S. population as a whole. SOURCES: EPA, 1994; Public Health Service, 1965. |
||||
Updating these numbers, there are over 54,000 systems in the US, and growth is almost exclusively in the very small sector. 93% are considered to be small or very small systems—serving fewer than 10,000 people. Even though these small systems are numerous, they serve only a small fraction of the population. Very small systems, those that serve 3,300 people or fewer make up 84 percent of systems, yet serve 10 percent of the population. Most critical is the 30,000 new very small systems that serve only 5 million people (averaging 170 per system). In contrast, the very large systems currently serve 45% of the population. Large plus very large make it 80%. The 800 largest systems (1.6%) serve more than 56 percent of the population. 900 new systems were added, but large systems served an additional 90 million people.
What this information suggests if that the large and very large sector has the ability to raise funds to deal with infrastructure needs (as they have historically), but that there may be a significant issue for smaller, rural system that have grown up with federal funds over the past 50 years. As these system start to come to the end of their useful life, rural customers are in for a significant rate shock. Pipeline average $100 per foot to install. In and urban area with say, 60 ft lots, that is $3000/household. In rural communities, the residents may be far more spread out. As an example, a system I am familiar with in the Carolinas, a two mile loop served 100 houses. That is a $1.05 million pipeline for 100 hours or $10,500 per house. With dwindling federal funds, rural customers, who are already making 20% less than their urban counterparts, and who are used to very low rates, that generally do not account for replacement funding, will find major sticker shock.
This large number of relatively small utilities may not have the operating expertise, financial and technological capability or economies of scale to provide services or raise capital to upgrade or maintain their infrastructure. Keep in mind that small systems have less resources and less available expertise. In contrast the record of large and very large utilities, EPA reports that 3.5 percent of all U.S. community water systems violated Safe Drinking Water Act microbiological standards one or more times between October 1992 and January 1995, and 1.3 percent violated chemical standards, according to data from the U.S. Environmental Protection Agency (EPA)..
EPA and professionals have long argued that centralized infrastructure for water and sewer utilities makes sense form an economy of scale perspective. Centralized drinking water supply infrastructure in the United States consists dams, wells, treatment plants, reservoirs, tanks, pumps and 2 million miles of pipe and appurtenances. In total this infrastructure asset value is in the multi-trillion dollar range. Likewise centralized sanitation infrastructure in the U.S. consists of 1.2 million miles of sewers and 22 million manholes, along with pump stations, treatment plants and disposal solutions in 16,024 systems. It is difficult to build small reservoirs, dams, and treatment plants as they each cast far more per gallon to construct than larger systems. Likewise operations, despite the allowance to have less on-site supervision, is far less per thousand gallons for large utilities when compared to small ones. The following data shows that the economy-of-scale argument is true:
Having reviewed the operations costs, the next step was to review the existing rates. Given the economy-of-scale apparent in Figures 2 to 6, it was expected that there would be a tendency for smaller system to have higher rates. Figures 2-6 demonstrate this phenomena.
So what to do? This is the challenge. Rate hikes are the first issue, a tough sell in areas generally opposed to increases in taxes, rates and charges and who use voting to impose their desires. Consolidation is anothe5r answer, but this is on contrast to the independent nature of many rural communities. Onslow County, NC figured out this was the only way to serve people efficiently 10 years ago, but it is a rougher sell in many, more rural communities. Infrastructure banks might help, the question is who will create them and will the small system be able to afford to access them. Commercial financing will be difficult because there is simply not enough income to offset the risk. The key is to start planning now for the coming issue and realize that water is more valuable than your iPhone, internet, and cable tv. In most cases we pay more for each of them than water (see Figure 7). There is something wrong with that…
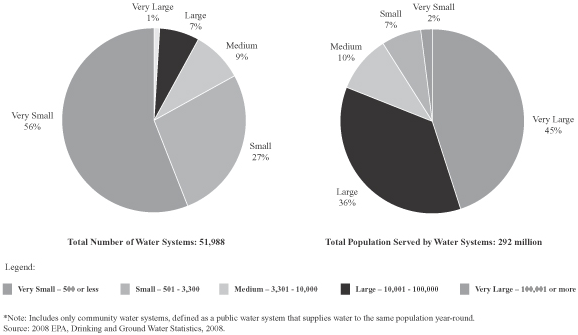
Figure 1 Breakdown of Size of Systems

Fig 2 Cost of Water Treatment
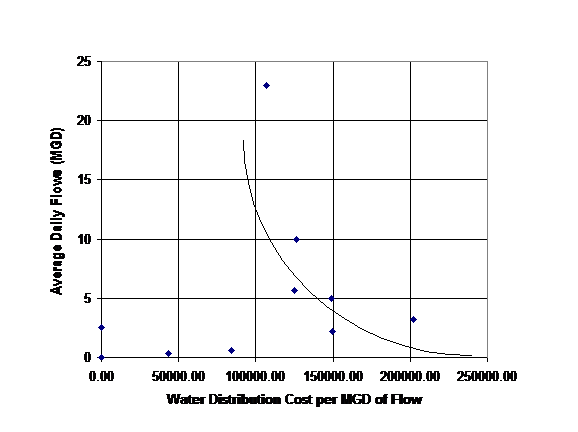
Fig 3 Cost of Water Distribution
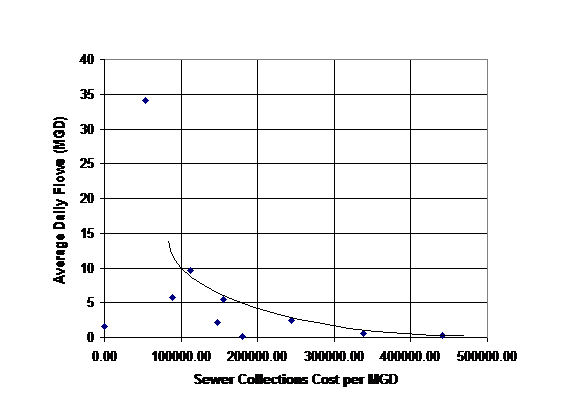
Fig 4 Cost of Sewer Collection

Fig 5 Cost of Sewer Treatment

Fig 6 Cost of Administration as a percent of total budget

FIgure 7 Water vs other utilities
Local utilities are among the largest power users in their communities. This is why power companies make agreements with utilities at reduced cost if the utilities will install backup power supplies. The peak power generation capacity as well as backup capacity is at the local utilities and other large users. Power companies can delegate this capital cost to large users without the investment concerns. It works for both parties. In addition, power companies spend effort to be more efficient with current power supplies, because recovering the costs for new, large plants is difficult, and in ways, cost prohibitive. Hence small increment options are attractive, especially when they are within high demand areas (distributed power). The use of localized wind, solar and on-site energy options like biogas are cost effective investments if sites can be found. That is where the utilities come in. Many utilities have sites. Large water utilities may have large reservoirs and tank sites that might be conducive to wind or solar arrays. Wind potential exists where there are thermal gradients or topography like mountains. Plant sites with many buildings and impervious areas could also be candidates for solar arrays and mini-wind turbines. Wastewater plants are gold mines for digester gas that is usually of high enough quantity to drive turbines directly. So utilities offer potential to increase distributed power supplies, but many water/wastewater utilities lack the expertise to develop and maintain these new options, and the greatest benefit is really to power companies that may be willing to provide as much money in “rent” to the utilities as they can save. Power entities obviously have the expertise and embedded experience to run distributed options optimally. So why don’t we do this?
I would speculate several reasons. First, the water/wastewater utilities have not really considered the option, and if they do there is the fear of having other folks on secure treatment sites. That can be overcome. The power entities have not really looked at this either. The focus in the power industry is to move from oil-based fuels to natural gas to accumulate carbon credit futures, the potential for lower operating costs and better efficiency of current facilities to reduce the need for capital investments. Power entities operate in a tight margin just like water/wastewater utilities do so saving where you can is a benefit. There are limited dollars to invest on both sectors and political and/or public service commission issues to overcome to invest in distributed power options at water/wastewater facilities.
But a longer-term view is needed. While fossil fuels have worked for us for the last 100 years, the supply is finite. We are finding that all that fracking might not give us 200 years, but more like 20-40 years of fuel. We have not solved the vehicle fuel issue and fossil fuels appear to be the best solution for vehicles for the foreseeable future which means they will compete directly with power demands. Natural gas can be used for vehicles fairly easily as evidenced by the many transit and local government fleets that have already converted to CNG.
The long-term future demands a more sustainable green power solution. We can get to full renewable power in the next 100 years, but the low hanging fruit need to be implemented early on so that the optimization of the equipment and figuring out the variables that impact efficiency can be better understood than they are now. For example, Leadville, CO has a solar array, but the foot of snow that was on it last September didn’t allow it to work very well. And solar arrays do use water to clean the panels. Dirty panels are nowhere near as efficient as clean ones. We need to understand these variables.
Area that are self sufficient with respect to power will benefit as the 21st century moves forward. There are opportunities that have largely been ignored with respect to renewable power at water and wastewater facilities, and with wastewater plants there is a renewable fuel that is created constantly. Wastewater plants are also perfect places to receive sludge, grease, septage, etc which increase the gas productions. There are examples of this concept at work, but so far the effort is generally led by the wastewater utilities. An example is East Bay Municipal Utility District (Oakland, CA) which produces 120% of its power needs at its wastewater plant, so sells the excess power back to the power company. There are many large wastewater plants that use digester gas to create power on-site to heat digesters or operate equipment. Others burn sludge in on-site incinerators to produce power. But so far the utilities are only reducing their cost as opposed to increasing total renewable power supplies. A project is needed to understand the dynamics further. If you are interested, email me as I have several parties wishing to participate in such a venture.
