Archive

finance


As 2014 is only a month away, expect water and sewer infrastructure to become a major issue in Congress.  While Congress has failed to pass budgets on-time for many years, already there are discussions about the fate of federal share of SRF funds.  The President has recommended reduction in SRF funds of $472 million, although there is discussion of an infrastructure fund, while the House has recommended a 70% cut to the SRF program.  Clearly the House sees infrastructure funding as either unimportant (unlikely) or a local issue (more likely).  Past budgets have allocated over $1.4 billion, while the states put up a 20% match to the federal share.  A large cut in federal funds will reverberate through to local utilities, because many small and medium size utilities depend on SRF programs because they lack access to the bond market.  In addition, a delay in the budget passage due to Congressional wrangling affects the timing of SRF funds for states and utilities, potentially delaying infrastructure investments. 

This decrease in funding comes at a time when ASCE rates water and wastewater system condition as a D+ and estimates over $3 trillion in infrastructure investment will be needed by 2020.  USEPA notes that the condition of water and wastewater systems have reached a rehabilitation and replacement stage and that infrastructure funding for water and sewer should be increased by over $500 billion per year versus a decrease of similar amounts or more.  Case Equipment and author Dan McNichol have created a program titled “Dire Straits:  the Drive to Revive America’s Ailing Infrastructure” to educate local officials and the public about the issue with deteriorating infrastructure.  Keep in mind much of what has made the US a major economic force in the middle 20th century is the same infrastructure we are using today. Clearly there is technical momentum to indicate there is greater need to invest in infrastructure while the politicians move the other way.  The public, caught in the middle, hears the two sides and prefers less to pay on their bills, so sides with the politicians as opposed to the data. 

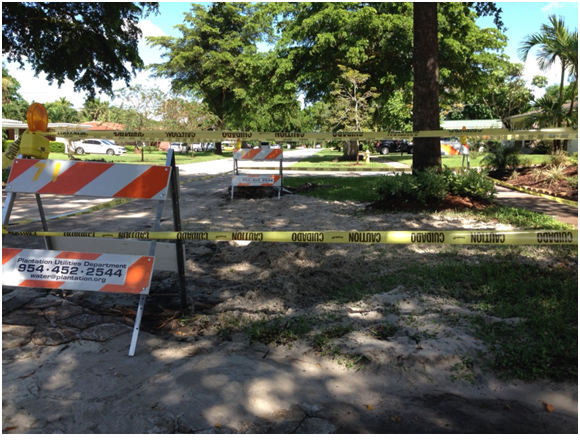
Local utilities need to join the fray as their ability to continue to provide high quality service.  We need to educate our customers on the condition of infrastructure serving them.  For example, the water main in front of my house is a 50 year old asbestos concrete pipe that has broken twice in the past 18 months. The neighborhood has suffered 5 of these breaks in the past 2 months, and the City Commission has delayed replacement of these lines for the last three years fearing reprisals from the public.  Oh and the road in front of my house is caving in next to where the leak was.  But little “marketing” by the City has occurred to show the public the problem.  It is no surprise then that the public does not recognize the concern until service is interrupted.  So far no plans to reinitiate the replacement in front of my house.  The Commission is too worried about rates.

Water and sewer utilities have been run like a business in most local governments for years  They are set up as enterprise funds and people pay for what they use.  Just like the private sector.  Where the process breaks down is when the price is limited while needs and expenses rise.  Utilities are relatively fixed in their operating costs and I have yet to find a utility with a host of excess: workers.  They simply do not operate in this manner.  Utilities need to engage the public in the infrastructure condition discourse, show them the problems, identify the funding needs, and gain public support to operate as any enterprise would – cover your costs and insure you keep the equipment (and pipes) maintained, replacing them when they are worn out.  Public health and our local economies depend on our service. Keep in mind this may become critical quickly given the House commentary.  For years the federal and state governments have suggested future funding may not be forthcoming at some point and that all infrastructure funding should be local.  That will be a major increase in local budgets, so if we are to raise the funds, we need to solicit ratepayer support.  Now!  


I recent Wall Street Journal article outlined where growth is likely to be coming.  Of no surprise, Arizona, Las Vegas, Central Valley, San Antonio, Dallas, Houston, Denver, Albuquerque, Boise, Pensacola, Tallahassee, Raleigh, Atlanta, and the Washington DC area.  Only one of those areas is has water much water availability.  It means that all of these communities are in areas that are water limited.  We already know that Texas, Las Vegas and Arizona have lots of water problems.  Most of these areas have had issues in the past as well, and will have more in the future. 

Low growth areas:  Detroit, Cleveland, Chicago, Buffalo, Cincinnati, Omaha, and a variety of areas with plenty of water, but old infrastructure and limited funding.  So the big questions is how do we redirect development to areas with plenty of water as opposed to allowing development in areas where we know that there will be serious water supply consequences in the future?  It’s a leadership issue, but local officials and states are so in need to the growth we have discussed in prior blogs, that the long-term realities of water supply limits overrides the short term need to show growth in the communities to delay tax increases, water increases and the like.  But is delays the inevitable, with potentially serious future impacts.


In front of house

The doorbell rang and it was 1:30 am on a Saturday morning.  It was my neighbor telling me about a small problem on the street.  I looked out and the entire block was flooded.  Water was moving. It was dark, and while my street light was working, it shed little light in the blackness.  However I figured out the old AC pipeline in front of my house had sheared and the block’s leak was actually my problem.  We had no water.  Fortunately the water department was able to get the main repaired in a couple hours.

The next morning we were not as lucky.  Another break on the next street over had shut us down again.  AC water main, but this time under a tree.  They had to remove the tree before fixing the line.  We were out all day.  The water plant guys and the repair crew said that the lines were supposed to be replaced a couple years ago, but that the City had delayed the replacement for budget problems.  


SUSTAINABILITY OF UTILITIES – PART 2

Let’s take a look at some scenarios. Let’s assume you are a utility that serves 20,000 people (8000 customers), with 60 miles of water pipe, 60 miles of sewer pipe, 17 lift stations, and a water and wastewater plant.  Replacing this infrastructure might be valued at $90 million for pipe, $35 million for treatment plants, water supply and pumping equipment (current day dollars).  Let’s also assume that their annual budget is $11 million and the typical demands are 3 MGD yielding a monthly bill of $115/mo (water and sewer).

Let’s make some general assumptions like that the pipe infrastructure might last 100 years, but clearly the treatment and mechanical parts would mot.  They would need ongoing maintenance and replacement.  50 years is probably too long, but let’s go with it.  If the overall costs increase at 3% per year and money is set aside for repair and replacement. The utility will see fairly steady rates if the customer base grows 2-3% per year.  Ten years out, the budget will be $16 million.  Now for the scenarios.

If the customer base has grown at 3% per year, the customers will increase to almost 27,000.  More of an issue is what happens if that increase in demand (from 3 to over 3.4 MGD) needs to come from a new water source and requires new capacity.  Many utilities will use impact fees to offset this cost to current customers so as not to adversely impact current customers too severely .That’s the current assumption.  The result looks like this at 10 and 20 years:


Component


Value today

10 years

20 years

Customers


20000

26878

36122


Accounts


8000

10751

14449


Water  Pipe

60 mi

 $   45,000,000

 $     98,509,418

 $215,646,786

Sewer Pipe

60 mi

 $   45,000,000

 $     98,509,418

 $215,646,786

Treatment Plants and Pumping

3 MGD

 $   35,000,000

 $     76,618,436

 $167,725,278

Operations budget


 $     9,000,000

 $     16,255,001

 $  29,358,340

Capital Budget


 $     1,600,000

 $       3,502,557

 $    7,667,441

Debt


 $        400,000

 $         400,000

 $      400,000

Monthly Amount


 $              115

 $                156

 $             216

Increase per year


5%

5%


Assume 1% of pipe Replacement Costs +2% Plant


Assume operating budget inc 3%/yr but construction increases 5%/yr


But what if the new treatment and supply are 50% more costly and impact fees assume the lower investment (typical)?  The cost for the budget and for the infrastructure replacement increases (with the delta from debt).  Cost are 50% higher:


Component


Value today

10 years

20 years

Customers


20000

26878

36122

Accounts


8000

10751

14449

Water  Pipe

60 mi

 $   45,000,000

 $     98,509,418

 $215,646,786

Sewer Pipe

60 mi

 $   45,000,000

 $     98,509,418

 $215,646,786

Treatment Plants and Pumping

3 MGD

 $   35,000,000

 $     92,289,117

 $202,029,937

Operations budget


 $     9,000,000

 $     23,731,487

 $  42,861,706

Capital Budget


 $     1,600,000

 $       3,815,971

 $    8,353,534

Debt


 $        400,000

 $       1,325,000

 $    2,825,000

Monthly Amount


 $              115

 $                224

 $             312

Increase per year


8%

7%


The normal assumptions are that growth will continue, but what if it does not?


What can be gleaned as a result of a non-growth or net decrease scenario?  How does sustainability get affected?  Let’s look at the no growth scenario.  In this light, rates will need to increase at least 5% per year to insure that the utility remains rate neutral.  If there is significant deferred maintenance, which is typical of may utilities, that cost will be added to the bill.  There are examples of utilities in Florida who finally caught up with deferred obligations which doubled their customers’ bill.  This scenario is doable, but the only real assumption changes that can be made are related to the lack of growth.  Deferring maintenance will once exacerbate the problem as there is not guarantee that growth will return.  Rate neutrality becomes a public relations issue, but not insurmountable.


Component


Value today

10 years

20 years


Customers


20000

20000

20000

Accounts


8000

8000

8000

Water  Pipe

60 mi

 $   45,000,000

 $     73,300,258

 $119,398,397

Sewer Pipe

60 mi

 $   45,000,000

 $     73,300,258

 $119,398,397

Treatment Plants and Pumping

3 MGD

 $   35,000,000

 $     57,011,312

 $  92,865,420

Operations budget


 $     9,000,000

 $     12,095,247

 $  16,255,001

Capital Budget


 $     1,600,000

 $       2,606,231

 $    4,245,276

Debt


 $        400,000

 $         400,000

 $      400,000

Monthly Amount


 $              115

 $                157

 $             218

Increase per year


5%

5%


Now let’s look at the decline issue.  If the population decreases by 25% over the ten year horizon, what does this say?  The costs will remain relatively constant, but the number of customers and demands for water will drive the rates up significantly. In ten years the rates could double in a community that is likely economically disadvantaged.  The higher rates may begin to discourage economic development, rate neutrality exacerbate the problem and may increase in costs for regulatory or deferred maintenance obligation becomes a significant issue:


Component


Value today

10 years

20 years

Customers


20000

16341

13352


Accounts


8000

6537

5341


Water  Pipe

60 mi

 $   45,000,000

 $     73,300,258

 $119,398,397


Sewer Pipe

60 mi

 $   45,000,000

 $     73,300,258

 $119,398,397


Treatment Plants and Pumping

3 MGD

 $   35,000,000

 $     57,011,312

 $  92,865,420


Operations budget


 $     9,000,000

 $     12,095,247

 $  16,255,001


Capital Budget


 $     1,600,000

 $       2,606,231

 $    4,245,276


Debt


 $        400,000

 $         400,000

 $      400,000


Monthly Amount


 $              115

 $                193

 $             326


7%

7%


Assume 1% of pipe Replacement Costs +2% Plant


Assume operating budget inc 3%/yr but construction increases 5%/yr


 What can we glean from this?  Interestingly the failure to accumulate costs for growth, and the declining rate base end up with similar monthly costs.  Only by the no growth and collecting appropriate impact fees will costs be controlled, and even in that case, costs will double every 20 years or less.  The reality is that the failure to follow proper revenue collection protocols will severely limit the utility in future years.  High capital costs impact rates significantly.  Leaving it to some future commissioner to raise the rates is unfair to both the future decision-makers and customers.  It does not make you a leader either. 


Pipe wears out.  Concrete deteriorates, Steel rusts.  Aluminum pits. Mines play out.  Wells run dry.  But we strive for sustainability.  How do these disparate facts coexist simultaneously?  And if they don’t, how does this impact our long term prospects for our utility systems and communities.  And how do the decisions impact our understanding of sustainability.

An AWWA publication from 2010 was a compendium of thoughts on the meaning of sustainability form the perspective of water utilities.  One of the findings of the publication was that the understanding of sustainability had more to do with the perspective of the person being asked about sustainability than an overall comprehension of the inter-relationships of the concept of sustainability among different sectors.  For water supply entities, the economic sustainability of the community is not really their primary concern.  Instead they focus more on impacts to customers.  But water is a driver for economic development in a community. 

The message is that water utilities may need to look at the broader picture of sustainability in their community and extend the definitions to a wider range because no one else is and the community is looking for leadership.  The first paragraph focuses on infrastructure issues, which are commonly ignored in dealing with the concept of sustainability, but they are the ones traditionally focused on water supply issues.  The utility needs to look at infrastructure and financial outlook as a part of an overall sustainability strategy. 

There are certain assumptions that we make on many of our systems, and perhaps we need to revisit some of these assumptions in light of potential future realities.  For example, what happens to communities that do not grow?  Our current assumptions generally assume that there will be an ongoing increase in population or water use that will drive increases in revenues without specific increases on customers.  However what if you are Detroit where the populations has dropped in half in the past 50 years.  How do we deal with aging infrastructure and demands for increased water quality and reliability while maintaining fees at affordable levels for customers?  This is a particular problem when there are economic disruptions that create a large group of disenfranchised people who become more economically disadvantaged than they might otherwise already be.  The competition for sustaining water rates, infrastructure condition and water supplies can be a difficult conundrum.


A recent article in the South Florida SunSentinel newspaper raised an interesting question.  What they did was line up all the cities in the county and identify the total fees paid to the City by residents.  They took the tax rates, plus water, sewer, storm water, fire, garbage and any other fees.  The article raised an interesting question.  For example, Hollywood, West Park and Lauderdale Lakes had the highest cost per household – in excess of $3500/year.  The other end of the spectrum was Hillsboro Beach, Sea Ranch Lakes and Southwest Ranches, each under $2000/household.  Of note is that Southwest Ranches provides no water or sewer service (all wells and septic tanks on large lots), so a direct comparison is not really appropriate.  Property taxes were low, but fire fees were really high.  Sea Ranch Lakes is a tiny community with no sewer, so again, not really a good comparison.  Hillsboro Beach is among the wealthiest communities, but also tiny. 

 Most communities had total fees between $2100 and 3200/resident.  Why the difference? First, the value of property varies widely.  West Park and Lauderdale lakes have among the lowest values per household, so their taxes must be higher to provide the same level of service.  Hollywood, and Dania Beach (#4 on the list) had higher water, sewer and storm water costs.  While both have recent, ongoing infrastructure programs, both have large transfers from the water and sewer fund to the general fund, and in both cases the water and sewer customer base does not match the property tax base.  In Dania Beach’s case, the service area is half the City, so those residents are supporting the property tax funded services at a higher rate than their neighbors.  Hollywood struggled with major budget issues to used water and sewer funds to balance the budget.

The problem that this article did not address, but should have was that where water, sewer and storm water costs were high, what was driving this? Was in infrastructure investments that others simply have yet to make?  That’s ok and the fact that these utilities invested now may be more timing.  If the result is due to transfers to the general fund, that is an entirely different, and somewhat disconcerting problem.  First since the service areas are not the same. There is a fairness issue.  Some residents pay more for the same services.  It means the water and sewer system is not really an enterprise, with rates based on service costs.  Instead it is being used as a tax source.


One of the more interesting issues in Congress the past years is the Farm Bill which did not pass the House.  The issue was too many food stamp recipients.  The program has doubled in the past 10 years and now 1 in 7 families depend on supplemental assistance.   But here is an interesting question – wouldn’t you assume that the states with the greatest percentage of people getting food stamps would be those states that voted for the Farm Bill.  That would be those Democratic states like California, Colorado, the New England States, Pennsylvania and New York?  Well interestingly enough, you would be wrong.  The state with the highest percentage of people receiving food stamps is Alabama, followed by New Mexico and Tennessee, which are red states.  In fact all of the southeastern states are in the upper two third, all exceeding 15% of households.  Yet their representatives voted against their constituents!  This should not be a surprise.  All of the “blue” states, except Washington and Oregon were below 15%.  Some were below 10%. 

So how does this affect water and sewer systems?  There is an ongoing effort at the EFC at UNC Chapel Hill and other areas regarding the concept of affordability of water and sewer services.  The concept is that costs in excess of 3.5 or 4.5 % of income may be burdensome on residents.  Effort is trying to come up with ideas to address low income ratepayers.  The loss of food stamps actually exacerbates this problem since most of these same ratepayers are the ones receiving food stamps.  The conflict between paying for food and water/sewer service increases, putting more low income residents at risk.  Congress is doing utilities no favors by disrupting embedded programs that people depend on.  We can debate whether the program, a transfer of funding from wealthier, blue states, to poorer, red states is a appropriate federal revenue transfer, but the reality is that the dependency has been created.  Compounding the problem is that employment is not nearly back to 2007 levels, and salaries for most of us have declined with respect to buying power over the past 30 years.  As a result, many residents, including many hardworking, employed residents, continue to struggle.  We should be concerned about the acts of Congress and remember some of our representatives may not be voting to help their constituents.  


In June, President Obama made a speech about the increase in renewable power that the United States had created in the last 4 years, and announced goals to double this amount in the next four.  Virtually all of this power was solar and wind power.  Little mention was made of hydroelectric or onsite sources.  But the latter have been around much longer than the former sources and there may be options to increase their contributions under the right circumstances. 


Hydroelectric power has been in use in the US for over 100 years.  By the 1930s, 40 percent of the nation’s power came from hydroelectric dams, including some fantastic accomplishments of the time like the Hoover Dam.  Today we have over 100,000 dams in the US, most of which provide power.  Today hydroelectric is only 6 percent of our total.   The reluctance to continue with hydroelectric power involved fisheries, land acquisition costs and legal issues.  Some hydropower options are excellent.  Hurting fisheries (which disrupt local economies dependent on those fisheries) may not be, and therein lies part of the dilemma.


But water and wastewater utilities are actively looking for means to reduce power costs.  Depending on the utility, pumping water can account for 80-90 percent of total power consumption, especially with high service pumps on water systems that require high pressures.  More efficient pumps is one obvious answer, but of fairly limited use unless your pumps are really old.  Variable speed drives can increase efficiency, and the cost is dropping.  But note that with all that high pressure, how do utilities recapture the energy?  We often don’t and the question is whether there is a means to do so that can benefit up.  The first step is looking at plant hydraulics.  Is there a way to recapture energy in the form a pressure.  For example of reverse osmosis systems, we can install a turbine to recapture the pressure on the concentrate side.  They are not very efficient at present, but the potential is there.  On long gravity pipe runs for water supply, a means to recapture pressure might also be available. 


Of course on-site generation of power is a potential solution. Water and sewer utilities have land, and on the wastewater side, methane, so producing power is possible.  This solution, however, may not be embraced by power utilities due to the potential revenue reduction potential and loss of embedded reserve capacity at water and wastewater plants.  As the water facility takes on on-site generation, their load profile may shift significantly placing them in under a different rate structure. This may greatly reduce the benefit to the facility.  There are, however, approaches to permit win-win solutions. The goal is to put willing power and water utilities together to permit local generation that will benefit both power and water utility systems to encourage public – private partnerships.  A medium to large wastewater plant can generate at least a third of its power needs.  Some even more if they take in grease, oils and other substances that should not be put into the sewer system.  The potential there is significant.  EBMUD has a plant that is a net seller of power.  We should look for opportunities.  But don’t forget, water utilities can create hydropower without impacting fish populations. We just need to seek out the right opportunities.


I love stories about sewage in print.  As a water/wastewater guy, it is amusing to see sewer stories in the local papers and national news when they are about the “oddities” of operations.  One recent article talked about the impact of “flushable items” that should not go down the toilet.  “Flushable” wipes was the offender this time, but past discussion involved tampons, diapers and paper towels.  The reality is that NONE of these items should ever go down the toilet.  Those paper toilet seat covers are questionable as well.  Let’s see why. 

Sewer agencies have a very different view of what is flushable that tampon manufacturers, diaper manufacturers, paper towel and now flushable wipe makers.  Sewer agencies are responsible to insure that waste moves down the gravity pipes and through the lift station pumps without creating backups in the system.  The majority of material in a sewer system is water.  Followed by chopped up solids.  The design of the toilet involved two separate concepts.  One is simply creating the opportunity for a syphon to move waste when flushed but holding water when not.  It is a gravity principle based on partial pressures.  Simple stuff.  But toilets also tend to “chop up” material when the flushing action occurs.  The flush is violent and thin toilet paper and the soft solids in the toilet are easily shredded and blended into the water.  Think about your blender.  Soft stuff gets chopped up.  Enough mixing, it is all liquid.  As a result there is very limited opportunity for either thin toilet paper or most solids to plug up a toilet. 

But people don’t like thin toilet paper.  So we have manufactures making toilet paper with cotton fibers in it to make the paper soft.  And people like the “high quality” paper towels that upscale restaurants use.  Unfortunately too many people use those high end paper towels on the toilet seat, so down they go.  Wipes are reinforced paper also.  Fibers make them strong enough to, well wipe.  Tampons are notorious as absorbant fibers.  The key in each case is the fibers.  Fibers are not chopped up during a flush because the toilet flush is not designed to shed cloth.  As a result two things happen.  First, the fibers then to stay together as a mass.  Grease and other materials in the sewer system will stick to eh fibers making an even larger glob of material.  A recent YouTube photos showed a 15 ton grease ball in a large sewer system.  Grease and fiberous materials in the sewer system – you don’t want that to plug up your interceptor.

The other problem is lift stations.  The pumps at lift stations are designed to pass a 2.5 in ball, but not a bunch of strings.  As a result the fibers get stretched out, and wind around the pump impeller rendering it useless.  Or the material may mat in the impeller preventing the pump from pumping water.  One of the most common lift station problems is fiberous material winding around impeller shafts that burn out pumps.  Pumps cost thousands of dollars to repair or replace, so this is money from the ratepayers’ pockets.  One of my clients had the restaurant problem.  The lift station impellers would completely clog every 3 days.  The lift station would nearly overflow before the pumps were removed, the guys would open up the pump, and dig out the material.  Obviously fiberous paper and there were only two connections to the lift station.  The City ended up installing a $160,000 grinder system to grind up this material because the restaurant was unwilling to change their practice.  The major offender was women using the paper towels as seat covers.  The lines inside were a mess as well. 

The moral of the story is that toilet paper, water and body waste goes down the sewer.  Not napkins, feminine hygiene products, baby wipes or any fiberous paper material that feels soft, but won’t deteriorate, regardless what the manufacturer claims on the box.  These material do not degrade, the only create costly repairs, inconvenient and costly backups and a host of other problems for downstream users and the utility.  Put this material in the proper trash can. 

And see where else can you talk about this stuff, except when talking about sewage?