Archive

infrastructure


Several weeks ago we looked at the phenomenon of population, income, education and unemployment.  The impact to from the combination of these factors in certain communities can be difficult.  Let’s explore a little further as there is more, interesting data every day.  The US Department of Agriculture is releasing its report of rural America.  The findings are interesting and counter-intuitive to the understanding of voters in many of those communities.  Their findings include:

  • The rural areas grew 0.5 % vs 1.6% in urban areas from mid-2011-mid 2012
  • Rural incomes are 17% lower than urban incomes.
  • The highest income rural works (95th percentile) earn 27% less than their urban counterparts
  • 17.7% of rural constituents live in poverty vs 14.5% in urban areas
  • 80% of the high poverty rate counties were rural
  • All the high income counties are urban.

Wow!  So the ghetto has move to the country? According to these statistics there is truth in that statement.  Let’s look a little further using some on-line mapping. 

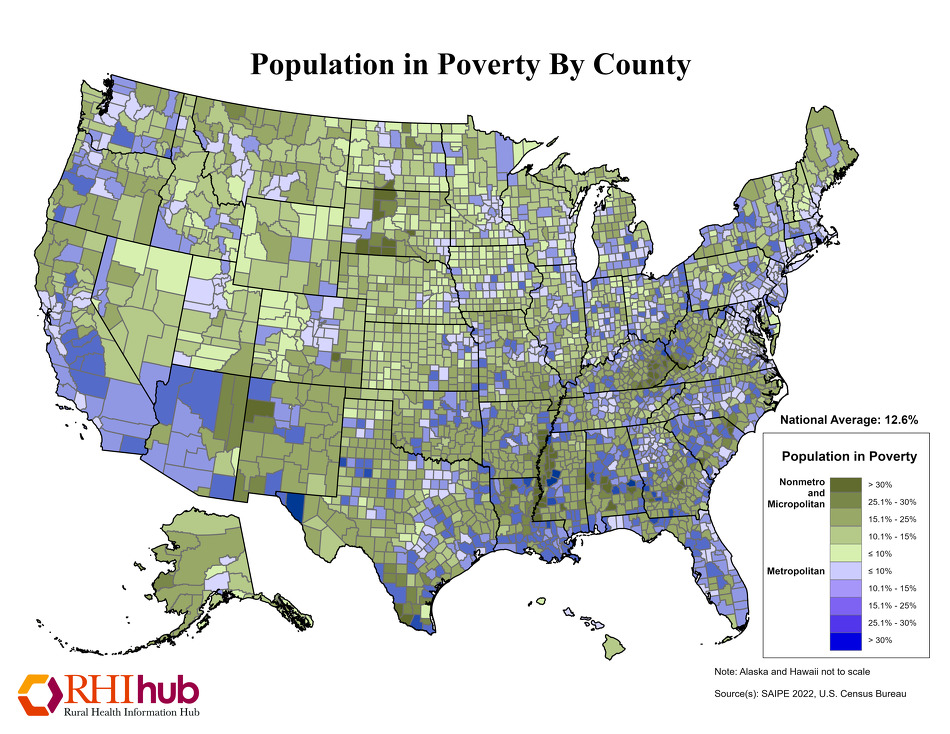
First let’s look at where these rural counties are.  Figure 1 is a map from www.dailyyonder.com  that shows (in green) the rural counties in the US.  Wikipaedia shows the 100 lowest income counties in Figure 2.  For the most part, these counties are rural, with the exceptions being a few areas in south Texas and in the Albuquerque/Santa Fe area of New Mexico. Raceonline.com shows the populations in poverty by county.  The red areas are the highest poverty rates.  The red areas in Figure 3 expand Figure 2 to include much of the rural deep south, Appalachia, more of Texas and New Mexico and part of the central valley in California.

Figure 4 shows how the number of young people has changed between 2000 and 2009 in rural counties (urban counties are white and not included – red means a decrease).  Figure 5 shows population growth (or not) by county. What you see in these two maps is that the young people are moving to the rocky mountain states and vacating the high poverty counties in Figure 3.  Yong people do not see jobs in the rural area – unemployment is 20% higher in rural America and the jobs that are there pay less.  Figures 6 and 7 show unemployment by County in 2008 after the start of the Great Recession and in 2013.  What these figures show is that with exception of the Plains states and Rockies, is that many of the areas with high poverty also had high unemployment, and that the unemployment has remains stubbornly high in many rural areas in the Deep South, Appalachia and New Mexico, plus high unemployment in parts to  the Great Lakes, but the poverty rates are still lower.  Education may by a factor in why the Plains states and Rocky Mountains have less unemployment – despite being rural their students are far more likely to graduate from high school than those in the deep South, Appalachia where unemployment remains high and incomes low. 

So what does this possibly have to do with utilities?  Utilities need to understand this problem as is demands some real, on-the-ground leadership.  Small and rural utilities are more costly to operate per thousand gallons than larger utilities.  A 1997 study by the author showed that economy-of-scale manifested itself to a great extent with water and wastewater operations.  The differences were not close – it is a lot less costly to operate large utilities vs small ones.  Rural utilities complicate the issue further because not only is the number of customers limited, but the pipe per customer is less so the capital investment per customer is far higher than in urban areas.  The impact is that utilities are under pressure to reduce rates to customers, or create a set of lower cost rates for those in poverty, while at the same time their costs are increasing and infrastructure demands are incrementally higher than their larger neighbors.  The scenario cannot be sustained, especially when large portions of rural infrastructure was installed with FHA grants, meaning the customers never paid for the capital cost in the first place.  There was no or lower debt, than what larger utility customers have.  The rural rates since these investments have been set artificially lower than they should as a result. But with Congress talking about reducing SRF and FHA programs, FHA is unlikely to step in to replace their initial investment, meaning that the billions of rural investment dollars that will be needed in the coming years will need to be locally derived, and rate shock will become a major source of controversy in areas that are largely very conservative politically and tend to vote against projects that will increase costs to them.

The good news is that much of the rural infrastructure may be newer when compared to much of the urban infrastructure.  So there is time to build the argument that local investment is needed.  The community needs to be engaged in this discussion sooner as opposed to when problems occur.  Saving for the infrastructure may be the best course since rural utilities will have limited access to the borrowing market because of their size, but that means raising rates now and keeping those saved funds as opposed to using them to deer rate increases.  If ongoing efforts in the House deplete federal funding further, the pinch will be felt sooner by rural customers who will lose the federal dollars from SRF and FHA programs. 


Image

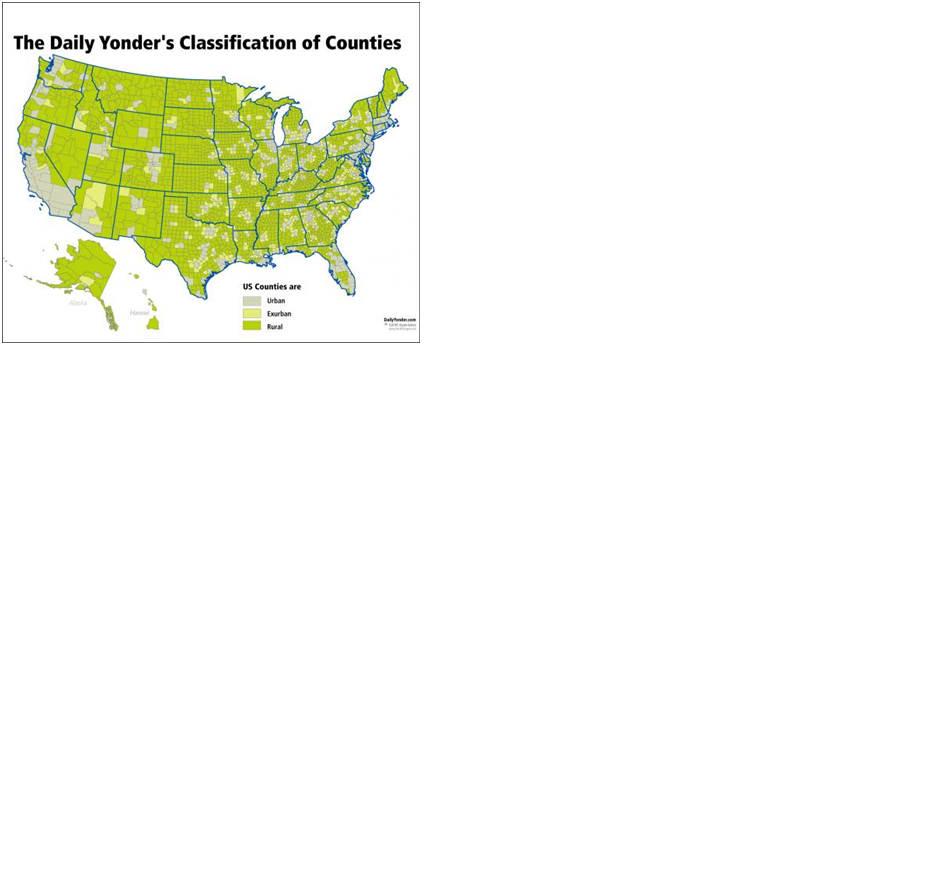
Figures 1 – Rural Counties

The United States: By Rural, Urban and Exurban Counties


Image


Figure 2.  100 lowest income Counties in the US


http://en.wikipedia.org/wiki/List_of_lowest-income_counties_in_the_United_States


Image

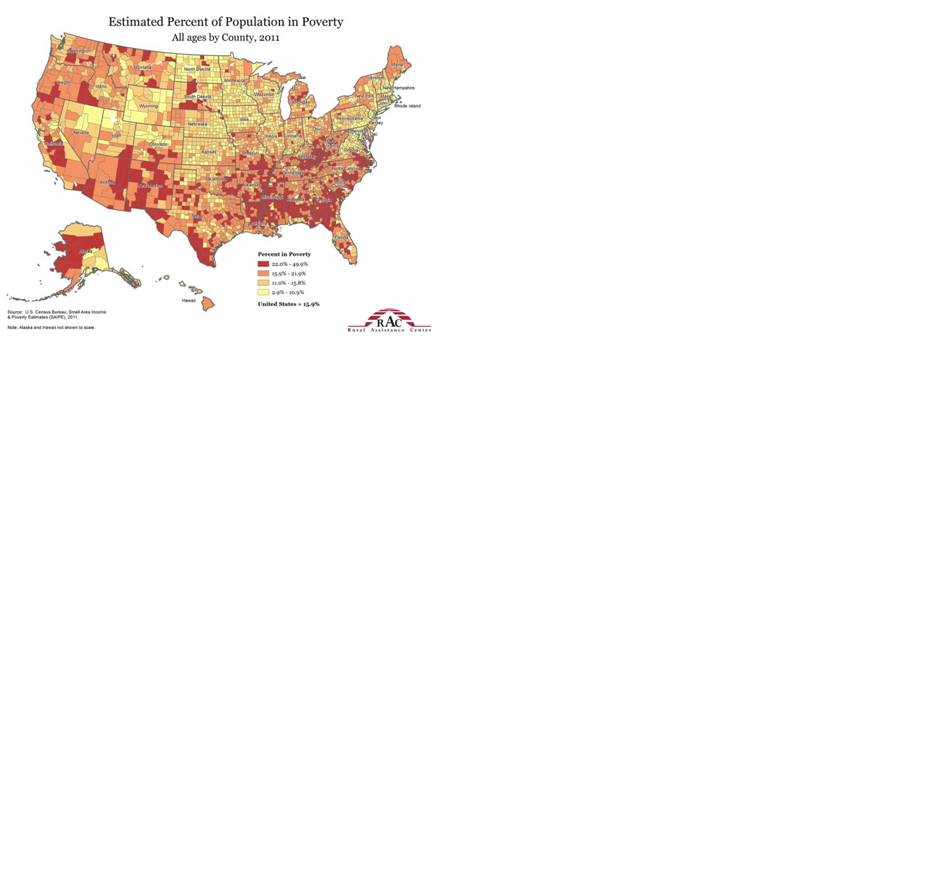
Figure 3.  Estimated population in poverty

http://www.raconline.org/racmaps/mapfiles/poverty.jpg


Image

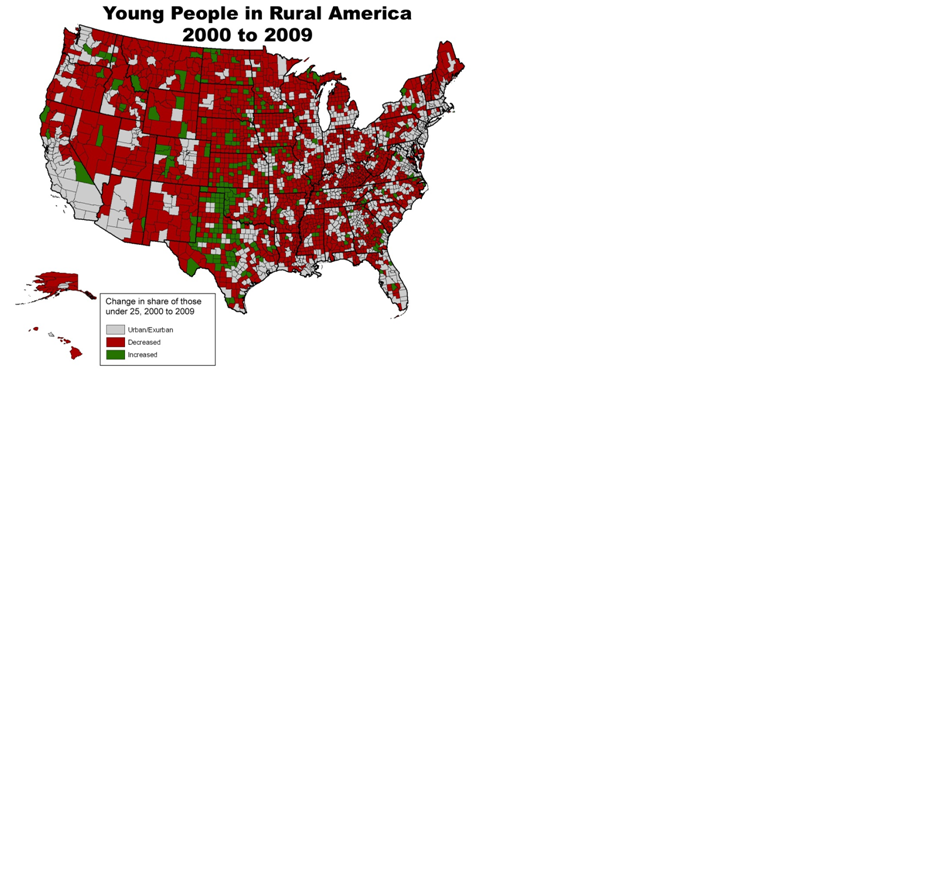
Figure 4.  Where the Young People Are

http://www.raconline.org/maps/topic_details.php?topic=55


Image


Figure 5.  Where people are moving to http://www.raconline.org/maps

Image


Figure 6  Unemployment 2008

http://en.wikipedia.org/wiki/Unemployment

Image

Figure 7  Unemployment 2013 http://www.huduser.org/portal/pdredge/pdr_edge_featd_article_040


Local utilities are among the largest power users in their communities.  This is why power companies make agreements with utilities at reduced cost if the utilities will install backup power supplies.  The peak power generation capacity as well as backup capacity is at the local utilities and other large users.  Power companies can delegate this capital cost to large users without the investment concerns.  It works for both parties.  In addition, power companies spend effort to be more efficient with current power supplies, because recovering the costs for new, large plants is difficult, and in ways, cost prohibitive.  Hence small increment options are attractive, especially when they are within high demand areas (distributed power).  The use of localized wind, solar and on-site energy options like biogas are cost effective investments if sites can be found.  That is where the utilities come in.  Many utilities have sites.  Large water utilities may have large reservoirs and tank sites that might be conducive to wind or solar arrays.  Wind potential exists where there are thermal gradients or topography like mountains.  Plant sites with many buildings and impervious areas could also be candidates for solar arrays and mini-wind turbines.  Wastewater plants are gold mines for digester gas that is usually of high enough quantity to drive turbines directly.  So utilities offer potential to increase distributed power supplies, but many water/wastewater utilities lack the expertise to develop and maintain these new options, and the greatest benefit is really to power companies that may be willing to provide as much money in “rent” to the utilities as they can save.   Power entities obviously have the expertise and embedded experience to run distributed options optimally.  So why don’t we do this?

I would speculate several reasons.  First, the water/wastewater utilities have not really considered the option, and if they do there is the fear of having other folks on secure treatment sites.  That can be overcome.  The power entities have not really looked at this either.  The focus in the power industry is to move from oil-based fuels to natural gas to accumulate carbon credit futures, the potential for lower operating costs and better efficiency of current facilities to reduce the need for capital investments.  Power entities operate in a tight margin just like water/wastewater utilities do so saving where you can is a benefit.  There are limited dollars to invest on both sectors and political and/or public service commission issues to overcome to invest in distributed power options at water/wastewater facilities. 

But a longer-term view is needed.  While fossil fuels have worked for us for the last 100 years, the supply is finite.  We are finding that all that fracking might not give us 200 years, but more like 20-40 years of fuel.  We have not solved the vehicle fuel issue and fossil fuels appear to be the best solution for vehicles for the foreseeable future which means they will compete directly with power demands.  Natural gas can be used for vehicles fairly easily as evidenced by the many transit and local government fleets that have already converted to CNG. 

The long-term future demands a more sustainable green power solution.  We can get to full renewable power in the next 100 years, but the low hanging fruit need to be implemented early on so that the optimization of the equipment and figuring out the variables that impact efficiency can be better understood than they are now.  For example, Leadville, CO has a solar array, but the foot of snow that was on it last September didn’t allow it to work very well.  And solar arrays do use water to clean the panels.  Dirty panels are nowhere near as efficient as clean ones.  We need to understand these variables.

Area that are self sufficient with respect to power will benefit as the 21st century moves forward.  There are opportunities that have largely been ignored with respect to renewable power at water and wastewater facilities, and with wastewater plants there is a renewable fuel that is created constantly.  Wastewater plants are also perfect places to receive sludge, grease, septage, etc which increase the gas productions.  There are examples of this concept at work, but so far the effort is generally led by the wastewater utilities.  An example is East Bay Municipal Utility District (Oakland, CA) which produces 120% of its power needs at its wastewater plant, so sells the excess power back to the power company.  There are many large wastewater plants that use digester gas to create power on-site to heat digesters or operate equipment.  Others burn sludge in on-site incinerators to produce power.  But so far the utilities are only reducing their cost as opposed to increasing total renewable power supplies.  A project is needed to understand the dynamics further.  If you are interested, email me as I have several parties wishing to participate in such a venture. 


As 2014 is only a month away, expect water and sewer infrastructure to become a major issue in Congress.  While Congress has failed to pass budgets on-time for many years, already there are discussions about the fate of federal share of SRF funds.  The President has recommended reduction in SRF funds of $472 million, although there is discussion of an infrastructure fund, while the House has recommended a 70% cut to the SRF program.  Clearly the House sees infrastructure funding as either unimportant (unlikely) or a local issue (more likely).  Past budgets have allocated over $1.4 billion, while the states put up a 20% match to the federal share.  A large cut in federal funds will reverberate through to local utilities, because many small and medium size utilities depend on SRF programs because they lack access to the bond market.  In addition, a delay in the budget passage due to Congressional wrangling affects the timing of SRF funds for states and utilities, potentially delaying infrastructure investments. 

This decrease in funding comes at a time when ASCE rates water and wastewater system condition as a D+ and estimates over $3 trillion in infrastructure investment will be needed by 2020.  USEPA notes that the condition of water and wastewater systems have reached a rehabilitation and replacement stage and that infrastructure funding for water and sewer should be increased by over $500 billion per year versus a decrease of similar amounts or more.  Case Equipment and author Dan McNichol have created a program titled “Dire Straits:  the Drive to Revive America’s Ailing Infrastructure” to educate local officials and the public about the issue with deteriorating infrastructure.  Keep in mind much of what has made the US a major economic force in the middle 20th century is the same infrastructure we are using today. Clearly there is technical momentum to indicate there is greater need to invest in infrastructure while the politicians move the other way.  The public, caught in the middle, hears the two sides and prefers less to pay on their bills, so sides with the politicians as opposed to the data. 

Local utilities need to join the fray as their ability to continue to provide high quality service.  We need to educate our customers on the condition of infrastructure serving them.  For example, the water main in front of my house is a 50 year old asbestos concrete pipe that has broken twice in the past 18 months. The neighborhood has suffered 5 of these breaks in the past 2 months, and the City Commission has delayed replacement of these lines for the last three years fearing reprisals from the public.  Oh and the road in front of my house is caving in next to where the leak was.  But little “marketing” by the City has occurred to show the public the problem.  It is no surprise then that the public does not recognize the concern until service is interrupted.  So far no plans to reinitiate the replacement in front of my house.  The Commission is too worried about rates.

Water and sewer utilities have been run like a business in most local governments for years  They are set up as enterprise funds and people pay for what they use.  Just like the private sector.  Where the process breaks down is when the price is limited while needs and expenses rise.  Utilities are relatively fixed in their operating costs and I have yet to find a utility with a host of excess: workers.  They simply do not operate in this manner.  Utilities need to engage the public in the infrastructure condition discourse, show them the problems, identify the funding needs, and gain public support to operate as any enterprise would – cover your costs and insure you keep the equipment (and pipes) maintained, replacing them when they are worn out.  Public health and our local economies depend on our service. Keep in mind this may become critical quickly given the House commentary.  For years the federal and state governments have suggested future funding may not be forthcoming at some point and that all infrastructure funding should be local.  That will be a major increase in local budgets, so if we are to raise the funds, we need to solicit ratepayer support.  Now!  


In front of house

The doorbell rang and it was 1:30 am on a Saturday morning.  It was my neighbor telling me about a small problem on the street.  I looked out and the entire block was flooded.  Water was moving. It was dark, and while my street light was working, it shed little light in the blackness.  However I figured out the old AC pipeline in front of my house had sheared and the block’s leak was actually my problem.  We had no water.  Fortunately the water department was able to get the main repaired in a couple hours.

The next morning we were not as lucky.  Another break on the next street over had shut us down again.  AC water main, but this time under a tree.  They had to remove the tree before fixing the line.  We were out all day.  The water plant guys and the repair crew said that the lines were supposed to be replaced a couple years ago, but that the City had delayed the replacement for budget problems.  


SUSTAINABILITY OF UTILITIES – PART 2

Let’s take a look at some scenarios. Let’s assume you are a utility that serves 20,000 people (8000 customers), with 60 miles of water pipe, 60 miles of sewer pipe, 17 lift stations, and a water and wastewater plant.  Replacing this infrastructure might be valued at $90 million for pipe, $35 million for treatment plants, water supply and pumping equipment (current day dollars).  Let’s also assume that their annual budget is $11 million and the typical demands are 3 MGD yielding a monthly bill of $115/mo (water and sewer).

Let’s make some general assumptions like that the pipe infrastructure might last 100 years, but clearly the treatment and mechanical parts would mot.  They would need ongoing maintenance and replacement.  50 years is probably too long, but let’s go with it.  If the overall costs increase at 3% per year and money is set aside for repair and replacement. The utility will see fairly steady rates if the customer base grows 2-3% per year.  Ten years out, the budget will be $16 million.  Now for the scenarios.

If the customer base has grown at 3% per year, the customers will increase to almost 27,000.  More of an issue is what happens if that increase in demand (from 3 to over 3.4 MGD) needs to come from a new water source and requires new capacity.  Many utilities will use impact fees to offset this cost to current customers so as not to adversely impact current customers too severely .That’s the current assumption.  The result looks like this at 10 and 20 years:


Component


Value today

10 years

20 years

Customers


20000

26878

36122


Accounts


8000

10751

14449


Water  Pipe

60 mi

 $   45,000,000

 $     98,509,418

 $215,646,786

Sewer Pipe

60 mi

 $   45,000,000

 $     98,509,418

 $215,646,786

Treatment Plants and Pumping

3 MGD

 $   35,000,000

 $     76,618,436

 $167,725,278

Operations budget


 $     9,000,000

 $     16,255,001

 $  29,358,340

Capital Budget


 $     1,600,000

 $       3,502,557

 $    7,667,441

Debt


 $        400,000

 $         400,000

 $      400,000

Monthly Amount


 $              115

 $                156

 $             216

Increase per year


5%

5%


Assume 1% of pipe Replacement Costs +2% Plant


Assume operating budget inc 3%/yr but construction increases 5%/yr


But what if the new treatment and supply are 50% more costly and impact fees assume the lower investment (typical)?  The cost for the budget and for the infrastructure replacement increases (with the delta from debt).  Cost are 50% higher:


Component


Value today

10 years

20 years

Customers


20000

26878

36122

Accounts


8000

10751

14449

Water  Pipe

60 mi

 $   45,000,000

 $     98,509,418

 $215,646,786

Sewer Pipe

60 mi

 $   45,000,000

 $     98,509,418

 $215,646,786

Treatment Plants and Pumping

3 MGD

 $   35,000,000

 $     92,289,117

 $202,029,937

Operations budget


 $     9,000,000

 $     23,731,487

 $  42,861,706

Capital Budget


 $     1,600,000

 $       3,815,971

 $    8,353,534

Debt


 $        400,000

 $       1,325,000

 $    2,825,000

Monthly Amount


 $              115

 $                224

 $             312

Increase per year


8%

7%


The normal assumptions are that growth will continue, but what if it does not?


What can be gleaned as a result of a non-growth or net decrease scenario?  How does sustainability get affected?  Let’s look at the no growth scenario.  In this light, rates will need to increase at least 5% per year to insure that the utility remains rate neutral.  If there is significant deferred maintenance, which is typical of may utilities, that cost will be added to the bill.  There are examples of utilities in Florida who finally caught up with deferred obligations which doubled their customers’ bill.  This scenario is doable, but the only real assumption changes that can be made are related to the lack of growth.  Deferring maintenance will once exacerbate the problem as there is not guarantee that growth will return.  Rate neutrality becomes a public relations issue, but not insurmountable.


Component


Value today

10 years

20 years


Customers


20000

20000

20000

Accounts


8000

8000

8000

Water  Pipe

60 mi

 $   45,000,000

 $     73,300,258

 $119,398,397

Sewer Pipe

60 mi

 $   45,000,000

 $     73,300,258

 $119,398,397

Treatment Plants and Pumping

3 MGD

 $   35,000,000

 $     57,011,312

 $  92,865,420

Operations budget


 $     9,000,000

 $     12,095,247

 $  16,255,001

Capital Budget


 $     1,600,000

 $       2,606,231

 $    4,245,276

Debt


 $        400,000

 $         400,000

 $      400,000

Monthly Amount


 $              115

 $                157

 $             218

Increase per year


5%

5%


Now let’s look at the decline issue.  If the population decreases by 25% over the ten year horizon, what does this say?  The costs will remain relatively constant, but the number of customers and demands for water will drive the rates up significantly. In ten years the rates could double in a community that is likely economically disadvantaged.  The higher rates may begin to discourage economic development, rate neutrality exacerbate the problem and may increase in costs for regulatory or deferred maintenance obligation becomes a significant issue:


Component


Value today

10 years

20 years

Customers


20000

16341

13352


Accounts


8000

6537

5341


Water  Pipe

60 mi

 $   45,000,000

 $     73,300,258

 $119,398,397


Sewer Pipe

60 mi

 $   45,000,000

 $     73,300,258

 $119,398,397


Treatment Plants and Pumping

3 MGD

 $   35,000,000

 $     57,011,312

 $  92,865,420


Operations budget


 $     9,000,000

 $     12,095,247

 $  16,255,001


Capital Budget


 $     1,600,000

 $       2,606,231

 $    4,245,276


Debt


 $        400,000

 $         400,000

 $      400,000


Monthly Amount


 $              115

 $                193

 $             326


7%

7%


Assume 1% of pipe Replacement Costs +2% Plant


Assume operating budget inc 3%/yr but construction increases 5%/yr


 What can we glean from this?  Interestingly the failure to accumulate costs for growth, and the declining rate base end up with similar monthly costs.  Only by the no growth and collecting appropriate impact fees will costs be controlled, and even in that case, costs will double every 20 years or less.  The reality is that the failure to follow proper revenue collection protocols will severely limit the utility in future years.  High capital costs impact rates significantly.  Leaving it to some future commissioner to raise the rates is unfair to both the future decision-makers and customers.  It does not make you a leader either. 


Pipe wears out.  Concrete deteriorates, Steel rusts.  Aluminum pits. Mines play out.  Wells run dry.  But we strive for sustainability.  How do these disparate facts coexist simultaneously?  And if they don’t, how does this impact our long term prospects for our utility systems and communities.  And how do the decisions impact our understanding of sustainability.

An AWWA publication from 2010 was a compendium of thoughts on the meaning of sustainability form the perspective of water utilities.  One of the findings of the publication was that the understanding of sustainability had more to do with the perspective of the person being asked about sustainability than an overall comprehension of the inter-relationships of the concept of sustainability among different sectors.  For water supply entities, the economic sustainability of the community is not really their primary concern.  Instead they focus more on impacts to customers.  But water is a driver for economic development in a community. 

The message is that water utilities may need to look at the broader picture of sustainability in their community and extend the definitions to a wider range because no one else is and the community is looking for leadership.  The first paragraph focuses on infrastructure issues, which are commonly ignored in dealing with the concept of sustainability, but they are the ones traditionally focused on water supply issues.  The utility needs to look at infrastructure and financial outlook as a part of an overall sustainability strategy. 

There are certain assumptions that we make on many of our systems, and perhaps we need to revisit some of these assumptions in light of potential future realities.  For example, what happens to communities that do not grow?  Our current assumptions generally assume that there will be an ongoing increase in population or water use that will drive increases in revenues without specific increases on customers.  However what if you are Detroit where the populations has dropped in half in the past 50 years.  How do we deal with aging infrastructure and demands for increased water quality and reliability while maintaining fees at affordable levels for customers?  This is a particular problem when there are economic disruptions that create a large group of disenfranchised people who become more economically disadvantaged than they might otherwise already be.  The competition for sustaining water rates, infrastructure condition and water supplies can be a difficult conundrum.


In June, President Obama made a speech about the increase in renewable power that the United States had created in the last 4 years, and announced goals to double this amount in the next four.  Virtually all of this power was solar and wind power.  Little mention was made of hydroelectric or onsite sources.  But the latter have been around much longer than the former sources and there may be options to increase their contributions under the right circumstances. 


Hydroelectric power has been in use in the US for over 100 years.  By the 1930s, 40 percent of the nation’s power came from hydroelectric dams, including some fantastic accomplishments of the time like the Hoover Dam.  Today we have over 100,000 dams in the US, most of which provide power.  Today hydroelectric is only 6 percent of our total.   The reluctance to continue with hydroelectric power involved fisheries, land acquisition costs and legal issues.  Some hydropower options are excellent.  Hurting fisheries (which disrupt local economies dependent on those fisheries) may not be, and therein lies part of the dilemma.


But water and wastewater utilities are actively looking for means to reduce power costs.  Depending on the utility, pumping water can account for 80-90 percent of total power consumption, especially with high service pumps on water systems that require high pressures.  More efficient pumps is one obvious answer, but of fairly limited use unless your pumps are really old.  Variable speed drives can increase efficiency, and the cost is dropping.  But note that with all that high pressure, how do utilities recapture the energy?  We often don’t and the question is whether there is a means to do so that can benefit up.  The first step is looking at plant hydraulics.  Is there a way to recapture energy in the form a pressure.  For example of reverse osmosis systems, we can install a turbine to recapture the pressure on the concentrate side.  They are not very efficient at present, but the potential is there.  On long gravity pipe runs for water supply, a means to recapture pressure might also be available. 


Of course on-site generation of power is a potential solution. Water and sewer utilities have land, and on the wastewater side, methane, so producing power is possible.  This solution, however, may not be embraced by power utilities due to the potential revenue reduction potential and loss of embedded reserve capacity at water and wastewater plants.  As the water facility takes on on-site generation, their load profile may shift significantly placing them in under a different rate structure. This may greatly reduce the benefit to the facility.  There are, however, approaches to permit win-win solutions. The goal is to put willing power and water utilities together to permit local generation that will benefit both power and water utility systems to encourage public – private partnerships.  A medium to large wastewater plant can generate at least a third of its power needs.  Some even more if they take in grease, oils and other substances that should not be put into the sewer system.  The potential there is significant.  EBMUD has a plant that is a net seller of power.  We should look for opportunities.  But don’t forget, water utilities can create hydropower without impacting fish populations. We just need to seek out the right opportunities.


I went to Colorado in July, and it was bone dry like I noted in a prior blog.  The trend was expected to continue, but then something happened.  It rained.  A lot. It’s been raining for almost a month.  Last week it was wet out there, really wet, devastatingly wet on the east side of Rocky Mountain National Park (Boulder, Estes Park, Longmont, Lyons). The rain has not really let up so mountain streams are over-running their banks, flooding streets, washing away bridges, damaging property and businesses.  Helicopter evaluation of the damage indicates that miles of roadways are badly damaged. Route 34/36, the primary eastern entrance to Rocky Mountain National Park may have 17 miles (of 20) damage pavement and foundation needing immediate repair.  Estes Park is cut off from the world and there was mud in the streets.  Rocky Mountain National Park is closed to allow access from Grand Lake for emergency vehicles, residents and supplies.  And eastern emergency route from Nederland is also available.  Tourism has halted in the peak of Fall tourist season.

How fortunes have changed, and continue to change.  Three years ago it was the west side of Colorado with 300 inches of snow that flooded downstream communities.  Three months ago was drought. Are these changes part of a larger issue, or a continuation of the status quo?  Hard to know, but certainly both events were far above any prior events experienced in the area.  The local infrastructure was not constructed to meet these conditions, so either the climate is changing, our models are wrong, or both.  We see the same issue playing out regularly around the world when the 100 year or 500 year storm event occurs and wreaks havoc on a community which does not have infrastructure planned for events like this.

 Expect NE Colorado to be a federal disaster area.  Expect billions to be spent on reconstruction of roadways.   But the larger question is whether the new, replacement infrastructure will survive a similar, or larger climate event in the future.  Will our infrastructure planning be short sighted or will it be adjusted accordingly?  The potential for us to protect infrastructure, and property is completely related to our ability to adjust to infrastructure needs and to minimize exposure to weather events.  Keep in mind our economy and way of life is directly related to our infrastructure condition.  But people want to live near rivers and streams, but rarely consider the real risk and consequences. 

How do we address these risks?  FEMA evaluates the probability of flooding to set flood insurance, but FEMA does not prevent construction in flood zones.  Where construction can occur is a state or local issue.  Of course, few local entities want to limit development in any way, so we keep putting people at risk.  Local officials, like those in Florida, keep pushing FEMA officials to reduce flood risks, despite evidence of increasing rainfall intensity that would increase flooding.  Florida is not alone.  No doubt Colorado officials have the same views.  We need to impress upon local officials the risks and encourage them to reduce risks to citizens.  It’s our tax money and insurance premiums they are raising.  But they are rarely held accountable.  Nor are non-elected officials.  Somehow, this needs to change.  We need leaders to stand up and draw the  line in the sand.


Why are health care costs increasing so fast?  Did you ever wonder about that?  We keep hearing about how health care costs, Medicare, Medicare, Obamacare are going to bankrupt us, but why is that?  Why are the cots going up so fast?  It is an important challenge for local officials and utilities who generally pay the health insurance costs for their workers.  There is more to the story that we are not being told.

One problem that get identified quickly is that only 80% of the population is included in the health care system.  Many who are not are “healthy” young people who don’t demand the services.  The concept of the health care bill was to solve this problem by spreading the costs of health care across the entire population using private and public providers.  First, I think there are way more unhealthy  people included in the 20% than we realize because the political dialogue keeps focusing on the few that want to live off the grid – I feel great so I don’t need insurance.  That guy is part of the problem.  That guy gets into a car accident, gets taken to a public hospital, gets treated, gets a bill for $26,000 to fix his broken leg, refuses to pay anything, and the taxpayers get stuck with the bill.  My solution to that guy is if you don’t want to pay for health insurance, bring cash.  Otherwise, “no soup for you!” to paraphrase a famous Seinfeld episode.  Of course my doctor, nurse and therapy friends think that’s a little cold hearted. 

The next argument is the cost of doctors, therapists and nurses.  Okay, I know a bunch of them, and that’s not where the money goes.  These people have lost money in the past 10 years.  Many are going form full-time to part-time employments as Medicare, Medicaid and health insurance bureaucrats decide services are no longer needed.  They will tell you the major change in their lives is paperwork….hold that thought for a moment.

The cost of drugs comes up.  Medicare and Medicare are the largest purchasers of pharmaceuticals in the world.  So in other works, they set the lowest price by supposedly bidding the “contracts” for services. Only there is often only one provider, so exactly how does that work?   Sounds like we don’t get a good deal there, which is why the arguments for importing Canadian drugs or drugs from Mexico keeps popping up.  They get a better deal than we do and most of these are supposedly AMERICAN companies.  No home town discount (I guess I know where free agent baseball players get the idea).   And my medical friends confirm this as an issue.  Check out the comments from Mr. Falloon at Life Extension (www.lef.org) for discussion. 

So let’s go back to the paperwork discussion.  Once upon a time doctors simply sent a little paperwork to the health insurance company or the federal government and said you needed some service.  And the insurance company processed the bill for the services.  The cost was paid by insurance premiums collected by the insurance company.  Everyone was happy.  But then someone at an insurance company said, “wait we could make more money if we asked more questions and paid less for these services.  It would help our bottom line.”  So you hear the complaint that the folks at the insurance companies are deciding whether you need that procedure or not.  And contractors decide if someone needs Medicare or Medicaid services, not the government, not your doctor, your nurse or your therapist.  Not any person that knows you, but some unseen, private sector bureaucrat who’s goal is to minimize the amount of your premium spent on services so they can enhance their bottom line.  And apparently they are very effective because the health insurance industry is very lucrative.  So maybe we have stumbled onto something here.  Maybe the cost of medical coverage is more related to drugs and bureaucracy (and it is not government bureaucracy!!) than the actual cost of services.  Maybe the old system, even if there was some fraud in it, wasn’t nearly as bad as it was made out to be.  It reminds me of one of the 4 laws of City management I developed years ago:  Never give elected officials a bad alternative – it becomes a magnet.  It always worked (hence a law).  I didn’t learn why until years later when I realized, that the worst option was the one all the lobbyists lobbied for even at the local level.  It was the option where they could make the most money “fixing