Archive

Risk Management


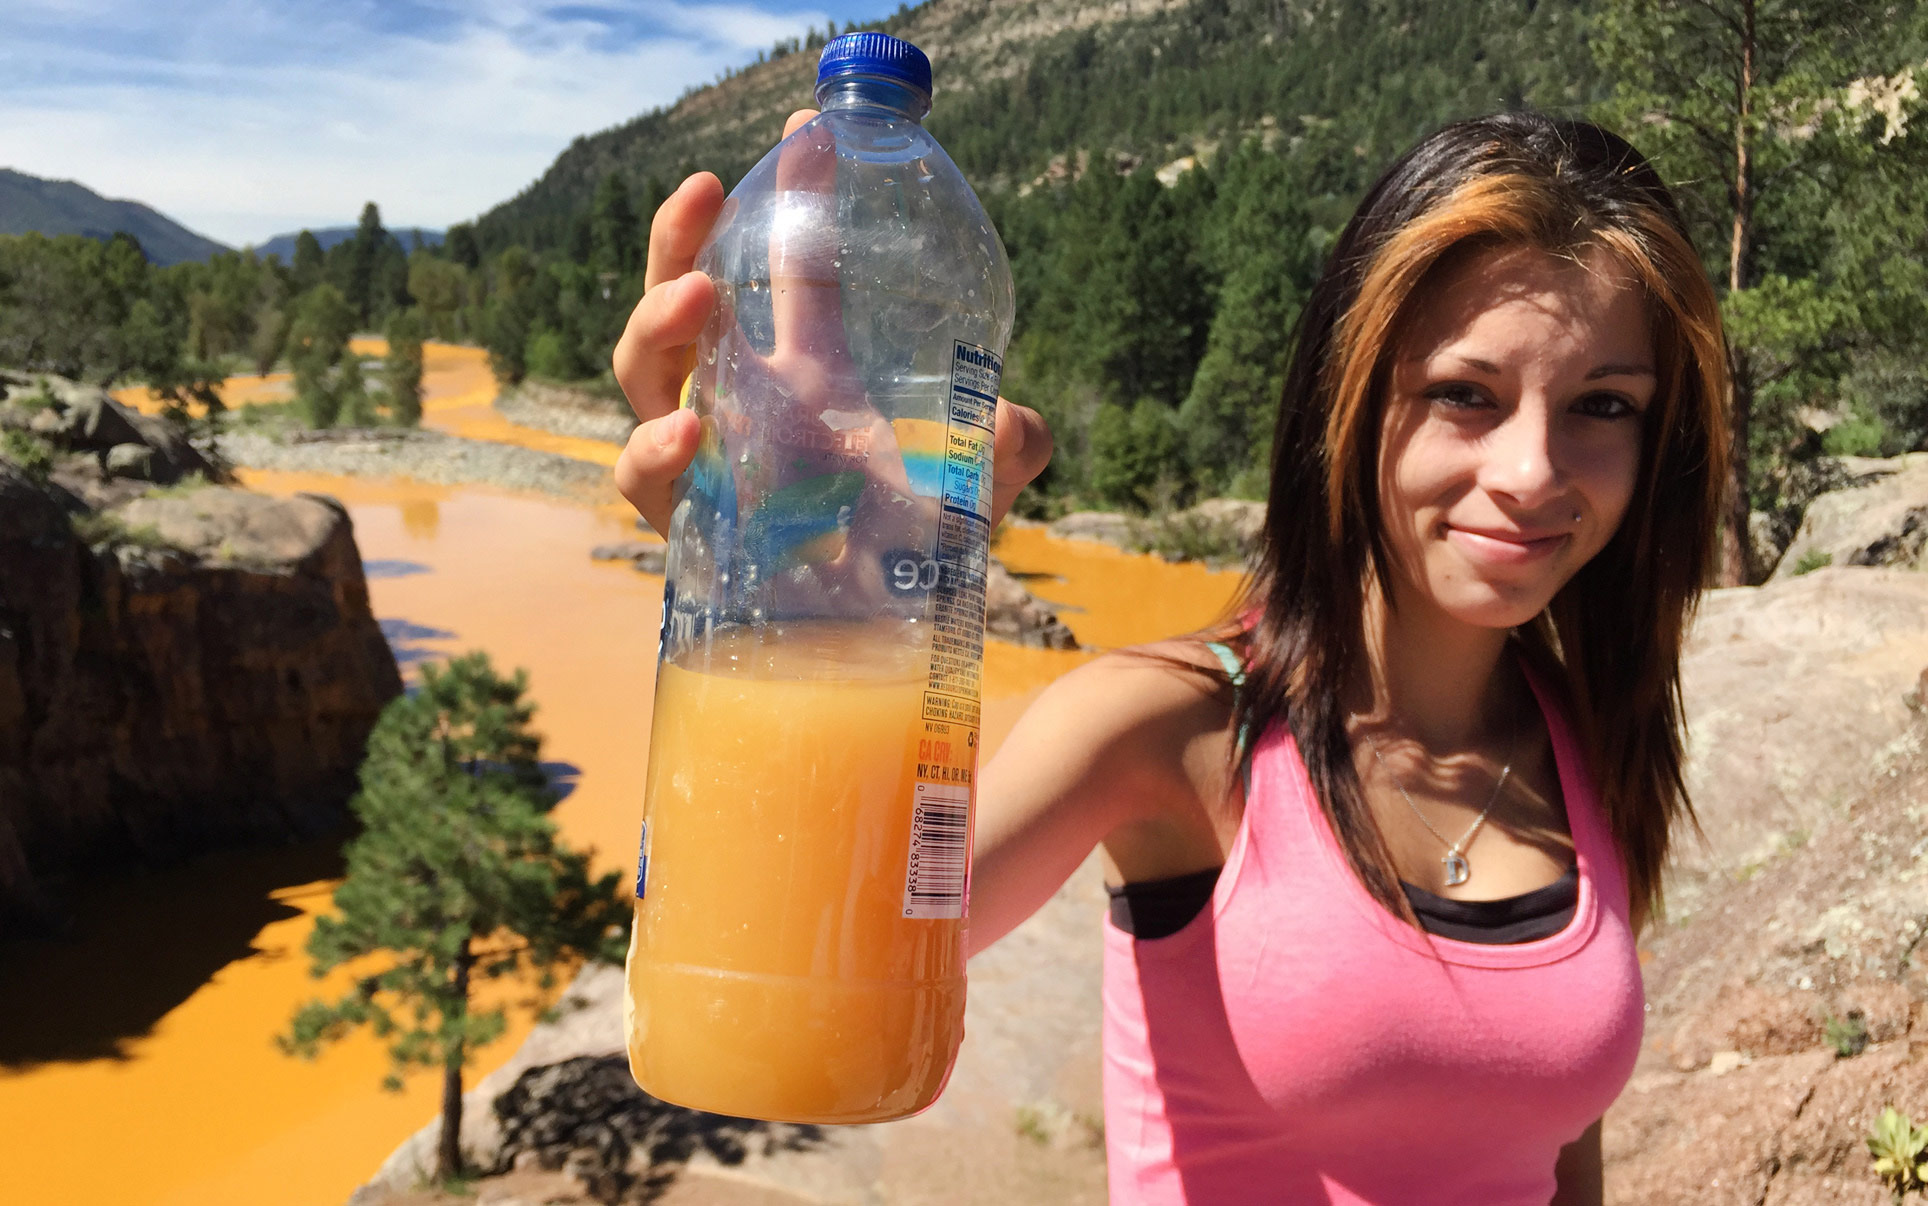
In an interesting twist of fate, USEPA caused a spill on the Animas River when a staffer accidently breached a dike holding back a solution of heavy metals at the Gold King mine because the misjudged the pressure behind the dike.  Pressure?  The spill flowed at 500 gpm (0.7 MGD), spilling yellow water spilled into the river.  Downstream, the plume has travelled through parts of Colorado, New Mexico and Utah, and will ultimately hit Lake Mead.  Officials, residents, and farmers are outraged.  People were told not to drink the water because the yellow water carried at least 200 times more arsenic and 3,500 times more lead than is considered safe for drinking. The conspiracy theorists are out.  The pictures are otherworldly.

colorado-mine-spillRayna Willhite holds a bottle of water she collected form the Animas River north of Durango Colo., on Thursday, August 6th, 2015. About a million gallons of toxic mine waste emptied out of the Gold King Mine north of Silverton that eventually made it into the Animas River. (Jerry McBride/Durango Herald via AP)

0807 colo spill epa-spill-

But they are all missing the point, and the problem.  This is one of hundreds of “legacy disasters” waiting to happen.  We are just surprised when they actually do.  A legacy disaster is one that is predicated on events that have happened in the past, that can impact the future.  In some cases the far past.  There are two big ones that linger over communities all over the west and the southeast – mines and coal.  Now don’t get me wrong, we have used coal and needed metals form mines.  That’s ok.  But the problem is no one has dealt with the effects of mining or coal ash for many years.  And then people are upset.  Why?  We can expect these issues to happen.

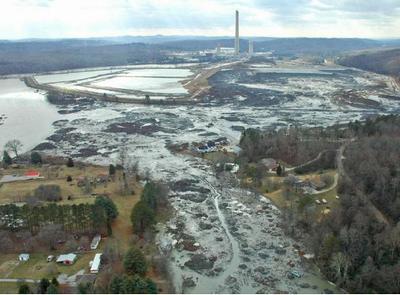
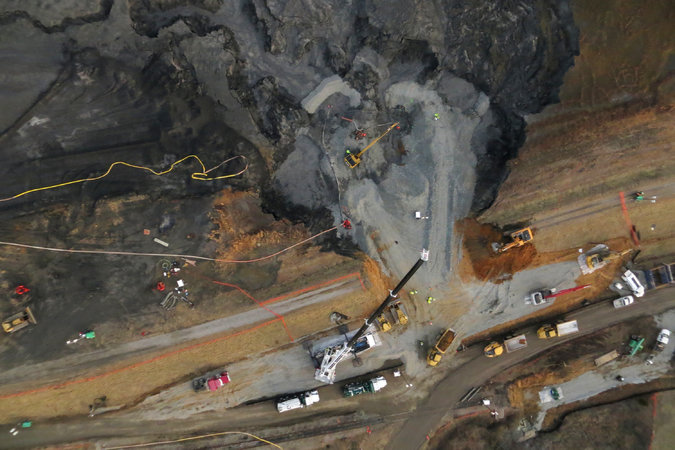
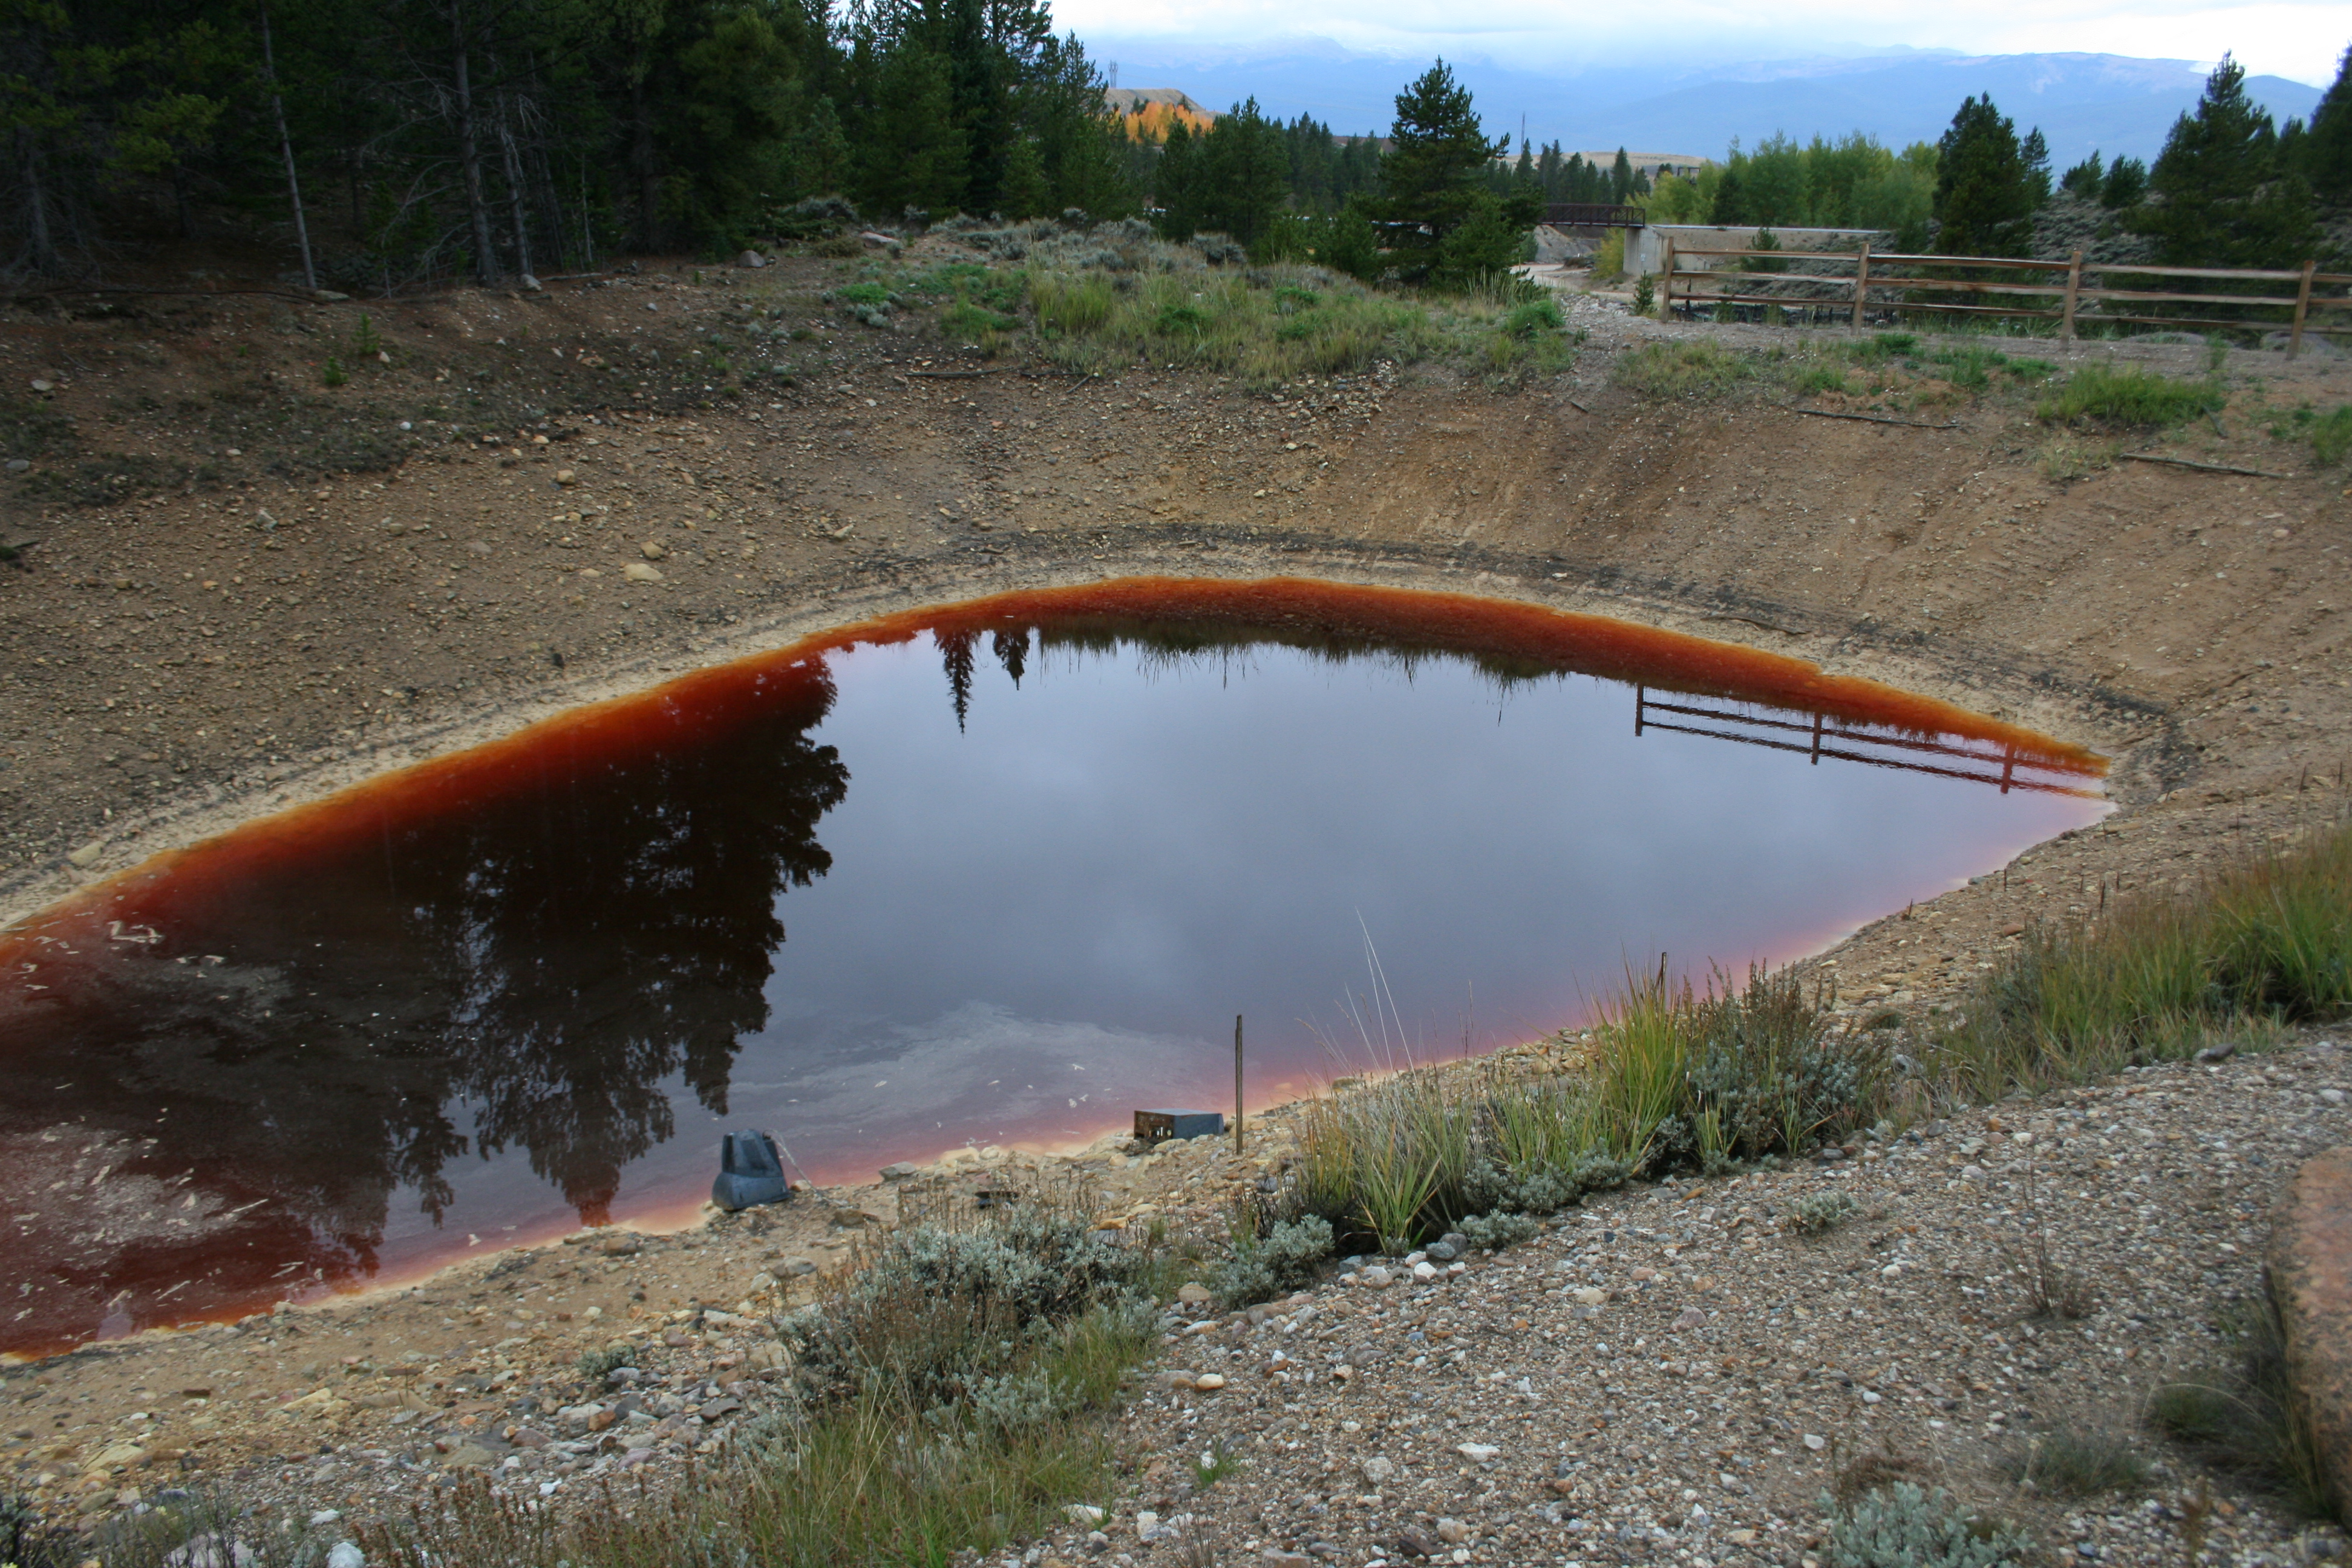
One major problem is that both are often located adjacent to or uphill from rivers.  That’s a disaster waiting to happen.  The King Gold mine is just the latest.  We had recent coal ash spills in Kingston, Tennessee (TVA, 2008) and the Dan River in 2014 (Duke Power). The Dan River spill was 30-40,000 tons.  Kingston cleanup has exceeded a billion dollars.  Coal ash is still stored at both places.  Next to rivers.  We had the federal government build ion exchange facilities in Leadville, CO and Idaho Springs, CO to deal with leaking water from mine tailings from the mountains. Examples are in the hundreds.  The photos are of the two coal spills, mine tailings that have been sitting the ground for 140 years in Leadville and one of the stormwater ponds – water is red in Leadville, not yellow.

kingston_coalash POLLUTE-master675 IMG_4803 IMG_6527 (2015_03_08 17_53_48 UTC)

When the disaster does occur, the federal government ends up fixing it, as opposed those responsible who are usually long gone or suddenly bankrupt, so it is no surprise that EPA and other regulatory folks are often very skeptical of mining operations, especially when large amounts of water are involved.  We can predict that a problem will happen, so expensive measures are often required to treat the waste and minimize the potential for damage from spills.  That costs money, but creates jobs.

For those long gone or bankrupt problems, Congress passed the Superfund legislation 40 years ago to provide cleanup funds.  But Congress deleted funding for the program in the early 2000s because they did not want to continue taxing the business community (mines, power plants, etc.).  So EPA uses ARRA funds from 2009.  And funding is down from historical levels, which makes some businesses and local communities happy.  The spectre of Superfund often impacts potential developers and buyers who are concerned about impacts to future residents.  We all remember Love Canals and Erin Brockovich.  Lack of development is “bad.”  They ignore the thousands or jobs and $31 billion in annual economic activity that cleanup creates, but it all about perception.

But squabbling about Superfund ignores the problem.  We continue to stockpile coal ash near rivers and have legacy mine problems.  Instead we should be asking different questions:

WHY are these sites permitted to store ash, tailings, and liquids near water bodies in the first place?  EPA would not be inspecting them if the wastes were not there.

WHY aren’t the current operators of these mines and power plants required to treat and remove the wastes immediately like wastewater operators do?  You cannot have millions of gallons of water, or tons of coal ash appear overnight on a site, which means these potential disasters are allowed to fester for long periods of time.  Coal ash is years.  Mine tailings… well, sometimes hundreds of years.

One resident on the news was reported to have said “Something should be done, something should be done to those who are responsible!”  Let’s start with not storing materials on site, next to rivers.  Let’s get the waste off site immediately and disposed of in a safe manner.  Let’s recover the metals.  Let’s start with Gold King mine.  Or Duke Power.  Or TVA.


The US EPA estimates that there is a $500 billion need for infrastructure investment by 2025.  The American Water Works Association estimate $1 trillion.  Congress recently passes the Water infrastructure Finance and Innovation Act (WIFIA) at $40 million/year, rising to $100 million in 5 years, which is a drop in the bucket.  Peanuts.  We have so many issues with infrastructure in the US and Congress tosses a few scheckles at the problem and thinks it is solved.  The reality is that the federal government wants to get out of the water infrastructure funding business and shift all water infrastructure to the local level.  This is a long-standing trend, going back to the conversion of the federal water and sewer grant programs to loan programs.

The reality is that local officials need to make their utility system self-sustaining and operating like a utility business whereby revenues are generated to cover needed maintenance and long-term system reliability.  The adage that “we can’t afford it” simply ignores the fact that most communities cannot afford NOT to maintain their utility system since the economic and social health of the community relies on safe potable water and wastewater systems operating 24/7.  Too often decision are made by elected officials who’s vision is limited by future elections as opposed to long-term viability and reliability of the utility system and community.  This is why boom communities fall precipitously, often never recovering – the boom is simply not sustainable.  Long-term planning is a minimum of 20 years, well beyond the next election and often beyond the reign of current managers.  Decisions today absolutely affect tomorrow’s operators.  Dependency on water rates may be a barrier, but this ignores the fact that power, telephone, cable television, gas, and internet access are generally more expensive hat either water or sewer in virtually all communities.  We need water. Not so sure about cable tv or he internet.  Great to have, but needed to survive?

The growth in costs can lead to mergers where a utility cannot afford to go it alone – as the economy of scale of larger operations continues to play out in communities.  Several small plants cannot operate at the same cost as one larger plant.  As a result larger projects will increase – from 87 to over 336 between 2005 and 2014.

But these costs are generally plant costs – treatment and storage, not piping.  Distribution pipelines remain the least recognized issue for water utilities (collection pipelines for sewer are similarly situated).  The initial Clean Water Act and Safe Drinking Water acts did not focus on piping systems – only treatment and supply.  The national Council on Public Works concluded their first assessment grade for infrastructure in the 1980s – but piping was not discussed.  ACSCE’s first report card in 1998 did not express concern about piping system.  Yet piping continues to age, and expose communities to risk.  In many communities greater than 50% of their assets are buried pipes.  Tools for assessing the condition of buried pipes especially water distribution pipes is limited to breaks and taps.  As a result the true risk to the community of pipe damage is underestimated and the potential for economic disruption increases.  The question is how do we lead our customers to investing in their/our future?  That is the question as the next 20 years play out.  Many risk issues will be exposed.  The fact that there are not more issues is completely related to the excellent work done by the utility employees.  More to come….


We are all cognizant of the low grades on infrastructure given annually by ASCE and periodically by USEPA.  We spend about 1.8% of our GNP on infrastructure.  We used to spend twice that much and it is likely that we need to spend upwards of 2.4% to stay even.  Much or our infrastructure is “forgotten” because it is buried.  American Water Works Association published a book to highlight his problem – Buried No Longer.  But is it helping.  In a recent Roads & Bridges article, they noted that the bridge system continues to age faster than the repair rate.  The states with more than 15% deficient bridges are mostly Great Plains states, and the northeast.  The latter is no surprise because the infrastructure is generally much older in the northeast.  What was also interesting was that in a recent American City and County magazine, many of the states that have bridge issues, also have below average trust among the public.  And most of the areas with the bridge issues are rural states, like North Dakota and West Virginia.  This harkens back to a prior couple blogs when it was noted that poorer, less educated people tend to live rural lifestyles, and lobby for less taxes, yet expect government to be there to resolve crises.  Interesting….


In the last blog we discussed 10 planning steps for sea level rises.  When planning 50-100 years other factors can come into play as well.  As a result, to allow flexibility in the analysis due to the range of increases within the different time periods, an approach that uses incremental increases of 1, 2, and 3 feet of SLR is suggested.  Hence infrastructure is built to meet milestones, not arbitrary dates lessening the potential for stranded assets.. The increments can work as threshold values in planning considerations in terms of allowing planners the ability to know ahead of time where the next set of vulnerable areas will be to allow a for proactive response approach that can be matched to the observed future sea levels.

But prior to developing infrastructure plans, the local community needs to define an acceptable level of service (LOS) for the community. A level service would indicate how often it is acceptable for flooding to occur in a community on an annual basis.  1% is 4 days per years and for a place like Miami Beach, this is nearly 2 ft NAVD88, well above the mean high tide.  The failure to establish an acceptable LOS is often the cause of failure or loss of confidence in a plan at a later point in time.  The effects of SLR of the level of service should be used to update the mapping to demonstrate how the level of service changes, so that a long-term LOS can be defined and used for near-term planning.

With the LOS known, the vulnerability assessment is developed using a GIS based map of topography and the groundwater levels associated with wet and dry season water levels.  LiDAR is a useful tool that may be available at very high resolution in coastal areas.  Topographic maps must be “ground-truthed” by tying it to local benchmarks and transportation plans.  USGS groundwater and NOAA tidal data from local monitoring stations to correlate with the groundwater information. Based on the results of these efforts, the GIS-based mapping will provide areas of likely flooding.

GIS map should be updated with layers of information for water mains, sewer mains, canals, catch basins, weirs and stormwater facilities.  Updating with critical infrastructure will provide a view of vulnerability of critical infrastructure that will be funded by the public sector. Ultimately policy makers will need more information to prioritize the needed improvements.  For example, a major goal may be to reduce Economic Vulnerability.  This means identifying where economic activity occurs and potential jobs.  At-risk populations, valuable property (tax base) and emergency response may be drivers, which means data from other sources should be added.

The next step is to analyze vulnerability spatially, by overlaying development priorities with expected climate change on GIS maps to identify hotspots where adaptation activities should be focused. This effort includes identification of the critical data gaps which, when filled, will enable more precise identification of at risk infrastructure and predictions of impacts on physical infrastructure and on communities. The final deliverable will include descriptions of the recommended concepts including schematics, cost estimates, and implementation plan.

So why go through all this.  Let’s go back to the beginning.  It has to do with community confidence in its leaders.  Resident look at whether their property will be protected.  Businesses look at long-term viability when making decisions about relocating enterprises.  The insurance industry, which has traditionally been focused on a one year vision of risk, is beginning to discuss long-term risks and not insuring property rebuild is risk-prone areas.  That will affect how bankers look at lending practices, which likely will decrease property values.  Hence it is in the community’s interests to develop a planning framework to adapt to sea level rise and protect vulnerable infrastructure through a long-term plan.  Plan or….


So Detroit defaulted on it’s debt obligations.  Do does that impact you?  Well, that depends on whether you are a utility looking revenue bonds, a city looking for general fund bonds or some combination.  The issue in Detroit with debt is that they pledged the full faith and credit of their taxing authority to repay the debt.  Their taxing ability was insufficient to accomplish this goal, which means that there could now be distrust in that promise for other cities.  So if you are a city and you are making this pledge, Detroit could impact you, or at least create more review on your balance sheets.  If you are a utility that is pledging revenues that have no limitations on amount, the concern is likely less.  Of course in either cases, the question is what the rest of your balance sheet looks like.  If you have no reserves, do not charge the full cost for service, have a heavy debt load, have high rates already, or send a lot of funds to the general fund, that could be a problem.  If you have avoided these pitfalls, the bond market will see much less of an issue. 

Keep in mind that Detroit is not the only default – another big one is the Birmingham and several other create questions about general fund uses of funds, which makes it of greater importance to keep our financial house in order.  IN part this can be done by creating the appropriate enterprise funds and remove those services from the general property tax fund.  That permits local focus on the true cost of general taxing users and creates a delineation between general fund and enterprise costs.  That can help elected officials focus on the true general fund issues:  police, fire, EMS, administration without hiding those costs with subsidies from other funds.


In front of house

The doorbell rang and it was 1:30 am on a Saturday morning.  It was my neighbor telling me about a small problem on the street.  I looked out and the entire block was flooded.  Water was moving. It was dark, and while my street light was working, it shed little light in the blackness.  However I figured out the old AC pipeline in front of my house had sheared and the block’s leak was actually my problem.  We had no water.  Fortunately the water department was able to get the main repaired in a couple hours.

The next morning we were not as lucky.  Another break on the next street over had shut us down again.  AC water main, but this time under a tree.  They had to remove the tree before fixing the line.  We were out all day.  The water plant guys and the repair crew said that the lines were supposed to be replaced a couple years ago, but that the City had delayed the replacement for budget problems.  


SUSTAINABILITY OF UTILITIES – PART 2

Let’s take a look at some scenarios. Let’s assume you are a utility that serves 20,000 people (8000 customers), with 60 miles of water pipe, 60 miles of sewer pipe, 17 lift stations, and a water and wastewater plant.  Replacing this infrastructure might be valued at $90 million for pipe, $35 million for treatment plants, water supply and pumping equipment (current day dollars).  Let’s also assume that their annual budget is $11 million and the typical demands are 3 MGD yielding a monthly bill of $115/mo (water and sewer).

Let’s make some general assumptions like that the pipe infrastructure might last 100 years, but clearly the treatment and mechanical parts would mot.  They would need ongoing maintenance and replacement.  50 years is probably too long, but let’s go with it.  If the overall costs increase at 3% per year and money is set aside for repair and replacement. The utility will see fairly steady rates if the customer base grows 2-3% per year.  Ten years out, the budget will be $16 million.  Now for the scenarios.

If the customer base has grown at 3% per year, the customers will increase to almost 27,000.  More of an issue is what happens if that increase in demand (from 3 to over 3.4 MGD) needs to come from a new water source and requires new capacity.  Many utilities will use impact fees to offset this cost to current customers so as not to adversely impact current customers too severely .That’s the current assumption.  The result looks like this at 10 and 20 years:


Component


Value today

10 years

20 years

Customers


20000

26878

36122


Accounts


8000

10751

14449


Water  Pipe

60 mi

 $   45,000,000

 $     98,509,418

 $215,646,786

Sewer Pipe

60 mi

 $   45,000,000

 $     98,509,418

 $215,646,786

Treatment Plants and Pumping

3 MGD

 $   35,000,000

 $     76,618,436

 $167,725,278

Operations budget


 $     9,000,000

 $     16,255,001

 $  29,358,340

Capital Budget


 $     1,600,000

 $       3,502,557

 $    7,667,441

Debt


 $        400,000

 $         400,000

 $      400,000

Monthly Amount


 $              115

 $                156

 $             216

Increase per year


5%

5%


Assume 1% of pipe Replacement Costs +2% Plant


Assume operating budget inc 3%/yr but construction increases 5%/yr


But what if the new treatment and supply are 50% more costly and impact fees assume the lower investment (typical)?  The cost for the budget and for the infrastructure replacement increases (with the delta from debt).  Cost are 50% higher:


Component


Value today

10 years

20 years

Customers


20000

26878

36122

Accounts


8000

10751

14449

Water  Pipe

60 mi

 $   45,000,000

 $     98,509,418

 $215,646,786

Sewer Pipe

60 mi

 $   45,000,000

 $     98,509,418

 $215,646,786

Treatment Plants and Pumping

3 MGD

 $   35,000,000

 $     92,289,117

 $202,029,937

Operations budget


 $     9,000,000

 $     23,731,487

 $  42,861,706

Capital Budget


 $     1,600,000

 $       3,815,971

 $    8,353,534

Debt


 $        400,000

 $       1,325,000

 $    2,825,000

Monthly Amount


 $              115

 $                224

 $             312

Increase per year


8%

7%


The normal assumptions are that growth will continue, but what if it does not?


What can be gleaned as a result of a non-growth or net decrease scenario?  How does sustainability get affected?  Let’s look at the no growth scenario.  In this light, rates will need to increase at least 5% per year to insure that the utility remains rate neutral.  If there is significant deferred maintenance, which is typical of may utilities, that cost will be added to the bill.  There are examples of utilities in Florida who finally caught up with deferred obligations which doubled their customers’ bill.  This scenario is doable, but the only real assumption changes that can be made are related to the lack of growth.  Deferring maintenance will once exacerbate the problem as there is not guarantee that growth will return.  Rate neutrality becomes a public relations issue, but not insurmountable.


Component


Value today

10 years

20 years


Customers


20000

20000

20000

Accounts


8000

8000

8000

Water  Pipe

60 mi

 $   45,000,000

 $     73,300,258

 $119,398,397

Sewer Pipe

60 mi

 $   45,000,000

 $     73,300,258

 $119,398,397

Treatment Plants and Pumping

3 MGD

 $   35,000,000

 $     57,011,312

 $  92,865,420

Operations budget


 $     9,000,000

 $     12,095,247

 $  16,255,001

Capital Budget


 $     1,600,000

 $       2,606,231

 $    4,245,276

Debt


 $        400,000

 $         400,000

 $      400,000

Monthly Amount


 $              115

 $                157

 $             218

Increase per year


5%

5%


Now let’s look at the decline issue.  If the population decreases by 25% over the ten year horizon, what does this say?  The costs will remain relatively constant, but the number of customers and demands for water will drive the rates up significantly. In ten years the rates could double in a community that is likely economically disadvantaged.  The higher rates may begin to discourage economic development, rate neutrality exacerbate the problem and may increase in costs for regulatory or deferred maintenance obligation becomes a significant issue:


Component


Value today

10 years

20 years

Customers


20000

16341

13352


Accounts


8000

6537

5341


Water  Pipe

60 mi

 $   45,000,000

 $     73,300,258

 $119,398,397


Sewer Pipe

60 mi

 $   45,000,000

 $     73,300,258

 $119,398,397


Treatment Plants and Pumping

3 MGD

 $   35,000,000

 $     57,011,312

 $  92,865,420


Operations budget


 $     9,000,000

 $     12,095,247

 $  16,255,001


Capital Budget


 $     1,600,000

 $       2,606,231

 $    4,245,276


Debt


 $        400,000

 $         400,000

 $      400,000


Monthly Amount


 $              115

 $                193

 $             326


7%

7%


Assume 1% of pipe Replacement Costs +2% Plant


Assume operating budget inc 3%/yr but construction increases 5%/yr


 What can we glean from this?  Interestingly the failure to accumulate costs for growth, and the declining rate base end up with similar monthly costs.  Only by the no growth and collecting appropriate impact fees will costs be controlled, and even in that case, costs will double every 20 years or less.  The reality is that the failure to follow proper revenue collection protocols will severely limit the utility in future years.  High capital costs impact rates significantly.  Leaving it to some future commissioner to raise the rates is unfair to both the future decision-makers and customers.  It does not make you a leader either. 


Pipe wears out.  Concrete deteriorates, Steel rusts.  Aluminum pits. Mines play out.  Wells run dry.  But we strive for sustainability.  How do these disparate facts coexist simultaneously?  And if they don’t, how does this impact our long term prospects for our utility systems and communities.  And how do the decisions impact our understanding of sustainability.

An AWWA publication from 2010 was a compendium of thoughts on the meaning of sustainability form the perspective of water utilities.  One of the findings of the publication was that the understanding of sustainability had more to do with the perspective of the person being asked about sustainability than an overall comprehension of the inter-relationships of the concept of sustainability among different sectors.  For water supply entities, the economic sustainability of the community is not really their primary concern.  Instead they focus more on impacts to customers.  But water is a driver for economic development in a community. 

The message is that water utilities may need to look at the broader picture of sustainability in their community and extend the definitions to a wider range because no one else is and the community is looking for leadership.  The first paragraph focuses on infrastructure issues, which are commonly ignored in dealing with the concept of sustainability, but they are the ones traditionally focused on water supply issues.  The utility needs to look at infrastructure and financial outlook as a part of an overall sustainability strategy. 

There are certain assumptions that we make on many of our systems, and perhaps we need to revisit some of these assumptions in light of potential future realities.  For example, what happens to communities that do not grow?  Our current assumptions generally assume that there will be an ongoing increase in population or water use that will drive increases in revenues without specific increases on customers.  However what if you are Detroit where the populations has dropped in half in the past 50 years.  How do we deal with aging infrastructure and demands for increased water quality and reliability while maintaining fees at affordable levels for customers?  This is a particular problem when there are economic disruptions that create a large group of disenfranchised people who become more economically disadvantaged than they might otherwise already be.  The competition for sustaining water rates, infrastructure condition and water supplies can be a difficult conundrum.


My apologies for being off line for a couple weeks.  We finished the summer semester the first week of August, and are now gearing up for the Fall semester.  Lots to do, and proposals and other projects to complete before the plunge.  The most interesting project this summer has been the conclusion of a national survey of aquifer storage and recovery (ASR) projects.  The concept of ASR wells is to store water underground until you need it later.  If you have a utility with limited water supplies, or if you have high demands a certain part of the year but not the rest, ASR has been touted as a solution.  Storage underground eliminates the evaporation losses, but the question has always been can you get the water back.  The survey, which will be fully published next year, shows 204 sites.  It shows only about a third are operational projects and over 50 that have been functionally abandoned.  The reasons for abandoning them include metals leaching(mostly a Florida problem), the inability to recovery the water (particularly a problem in brackish aquifers), lack of capacity and trihalomethanes (a regulatory issue in a couple states).  ASR was successful with limited injection rates (700 gpm) and where the aquifer was denuddded (South Carolina).  Growth seems to be in the west after a lot of effort in the southeast.  The road forward should prove interesting.  With completion of the study it is hoped that more data can be gleaned to indicate the factors that make ASR project successful, thereby increasing the rate of success for the future. 


In the past week I have had the opportunity to experience the extremes with water – heavy rains/tropical weather in SE Florida, and dry weather in Denver at America Water Works Association’s Annual Conferences and Exposition. Two months ago with was snowing in Denver and there had been limited rain in SE Florida. Six months ago we were both dry and there was significant concern about drought in both places. How quickly fortunes change and the associated attitudes as well. It is part of a perception problem – looking at the near term – instant gratification, as opposed the long-term consequences. In truth neither set of conditions is historically different or should have created major panic or much shift in attitudes, but it is the potential to predict conditions that require the water manager’s scrutiny. We have all become risk managers.

Managing risk is not in the job description of most water and sewer personnel (risk managers aside, and they are focused on liability risks from incidents caused by or incurred by the utility like accidents, not water supply risks). We spend a lot of effort on the engineering, operation and business side, but less on planning or risk/vulnerability assessments. EPA has required vulnerability assessments in the past, but having seen some of those exercises, most are fairly superficial and many put on a shelf and forgotten. I have had clients ask me if I still had copies because they did not. Clearly we need a renewed commitment to vulnerability assessment.

Vulnerability starts with water supplies. Groundwater is particularly tricky. A new USGS study reports significant decreases in water levels in many aquifers across the US, especially confined aquifers in the west. That situation is not improving, and the situation will not correct itself. Loss of your water supply is a huge vulnerability for a community. Finding a new supply is not nearly as simple as it sounds or as many are led to believe. Confined aquifers do not recharge quickly and therefore have finite amounts of water in them. Remove too much water and all too often land subsidence occurs, which means the aquifer collapses and will never hold the same amount of water. USGS has mapped this and it matches up well with the drawn down aquifers. More data needs to be collected, but Congress is looking to cut USGS funds for such purposes, just when conditions suggest the data is needed most.

Many watershed basins and many aquifers are over allocated and overdrawn, and not just in the west. New England and the Carolinas have examples. Overallocation means competition for water will increase with time and it will be utilities that everyone will look at to solve the problem. Afterall the utilities have money as opposed to agriculture and other users, right? To protect themselves, water utility managers will need to look beyond their “slice of the pie” to start discussions on the holistic benefits to water users throughout the watershed, which will extend to understanding economic and social impacts of water use decisions. It is not just about us, and paradigm shift that is coming and one that we as an industry need to be the leading edge for. Our use impacts others and vice versa. Every basin wants to grow and prosper, but decisions today may reduce our future potential. Klamath River is a great example of misallocated water priorities. The biggest potential economy in the basin is Salmon ($5B/yr), followed by tourism ($750 M and growing), which relies on fishing and hiking. But agriculture ($0.2 B/yr) get the water first. Then power, which warms the water (salmon like cold water). Then a few people (a few 100,000 at the most in the basin). The result, the salmon industry gets reduced to $50 M/yr. Now how could we create more jobs, which would result in more income and a bigger economy? The easy answer is encourage the salmon industry, but that doesn’t sit well with the other, smaller users that will become more vulnerable to losses.

I suggest that to harden our water future in any given basin, we need to start looking a little more holistically at the future. This type of analysis is clearly not in the job description of the utility or its managers, utility managers may have the best access to technical expertise and information. As a result to protect their interests and manage risk, we may need to shift that paradigm and become holistic water managers.