Archive

sustainability


An asset management program should be developed accordingly to the client’s goals and objectives. It consists of determining the selected area of study, type of system and the quality of data used for evaluation. Before a condition assessment can be determined, an inventory of assets needs to be established – maps, etc. are helpful.  So now you have a map of your water and sewer system and you want to develop a useful system for asset management.  Depending on the accuracy wanted, the data can be gathered in many ways ranging from onsite field investigation which could take a lot of time, to using existing maps, using maps while verifying the structures using aerial photography and video, or field investigations. But most local governments still lack data.  You cannot dig up pipe, or do a lot of destructive testing on buried infrastructure.  So what to do?

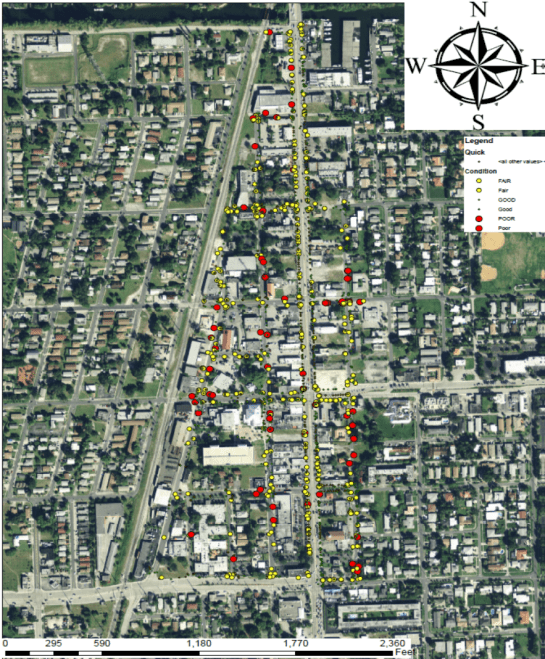
The reality is that you have a lot more data than one thinks.  For one thing, most utilities have a pretty good idea about the pipe materials.  Worker memory can be very useful, even if not completely accurate.  In most cases the depth of pipe is fairly similar – the deviations may be known. Soil conditions may be useful – there is an indication that that aggressive soil causes more corrosion in ductile iron pipe, and most soil information is readily available.  Likewise tree roots will wrap around water and sewer pipes, so their presence is detrimental.  Trees are easily noted from aerials.  Likewise road with truck traffic create more vibrations on roads, causing rocks to move toward the pipe and joints to flex.  So with a little research there are at least 5 variables known.  If the break history or sewer pipe condition is known, the impact of these factors can be developed via a linear regression program.  That can then be used as a predictive tool to help identify assets that are mostly likely to become a problem.   We are working on such an example now, but suspect that it will be slightly different for each utility.  Also, in smaller communities, many variables (ductile iron pipe, pvc pipe, soil condition…) may be so similar that differentiating would be unproductive.  That also remains to be seen, which brings up another possible variable- the field perception – what do the field crews recall about breaks?  Are there work orders?  If so do they contain the data needed to piece together missing variables that would be useful to add to the puzzle?

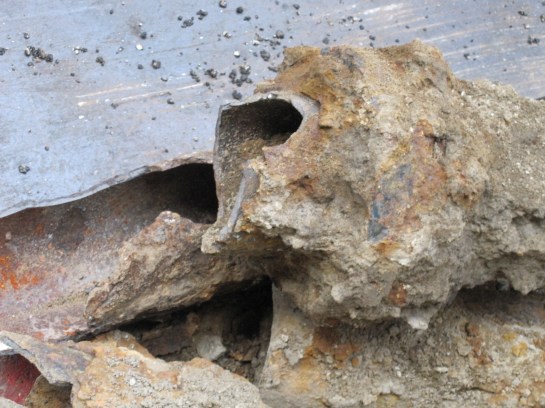
After all we want to avoid this before it happens….

IMG_5040


Asset management plays a vital role to help minimize unnecessary or misplaced spending while meeting the health and environmental needs of a community. The goal is to provide strategic continuous maintenance to the infrastructure before total failure occurs.  Costs should be well distributed over the life of the asset to help avoid emergency repairs. Emergency repairs can cost up to multiple times the cost of a planned repair. Therefore the ultimate goal of asset management is to provide quality, economical infrastructure by identifying the system’s needs and addressing the needs appropriately.  At some point repairs cost more than replacement, or technology may make repairs obsolete.

An asset management program should be developed accordingly to the client’s goals and objectives. It consists of determining the selected area of study, type of system and the quality of data used for evaluation (see Figure 1).  Before a condition assessment can be determined, an inventory of assets needs to be established. Depending on the accuracy wanted, the data can be gathered in many ways ranging from onsite field investigation which could take a lot of time, to using existing maps, using maps while verifying the structures using aerial photography and video, or field investigations. Not doing destructive testing is important to reduce costs.  The question is how you do it.  One project we did was the downtown area of Dania Beach.  You can see the areas that are a problem.

Untitled


Figure 1

Asset Dania

FIgure 2


WTPspiractorI have a question – what was the impact of the 2008 economic crisis on water and sewer infrastructure funding?  I have a hypothesis – the amount of monies transferred to non-water and sewer operations increased.  Is the hypothesis true?

The next question to answer is that if transfer monies increased, did they decrease once property values started to come back?  My hypothesis is no.

Finally what impact does this have on water and sewer infrastructure going forward?  I suspect that the answer is that we underfund infrastructure or justify the lack of funding through actuarial means (I actually had a utility director tell me that his pipes were designed to last 250 years.  Seriously.  Of course that is nonsense, but it is a means to keep your need for replacement funding down).

I have a student and we are working on these issues now.  We are going to gather data from several hundred utilities over the next six months, crunch 11 years of data and let’s find out.  If you or your clients are interested in adding your data to the mix, please send it to me.  I need 2005 -2015 expenditure info.  Also some operational data like ADF, MDF, miles of pipe, customers, treatment type and CCR. We will be publishing the results.   Should be interesting……


DSCF0032Curtailed water use and conservation are common topics of conversation in areas with water supplies limitations.  As drought conditions worsen, the need for action increases, so when creating a regulatory framework, or when trying to measure water use efficiency, water supply managers often look for easily applied metrics to determine where water use can be curtailed.  Unfortunately, the one-size-fits-all mentality comes with a potential price of failing to fully grasp the consequences decision-making based on such metrics.

One of the issues that water supply regulator like to use is per capita water use.  Per capital water use is often used to show where there is “wasted” water use, such as excessive irrigation.  However such a metric may not be truly applicable depending on other economic factors, and may even penalize successful communities with diverse economic bases.  A heavy industrial area or dense downtown commercial center may add to apparent per capita use, but is actually the result of vibrant economic activity. Large employment centers tend to have higher per capital use than their neighbors as a result of attracting employees to downtown, which are not included in the population.

In south Florida, a recent project I was involved with with one of my students showed that while there was significant variability among utilities, but the general trend of increased economic activity was related to increased per capita use.  Among the significant actors were health care, retail trade, food service and scientific and technical services.  It appears to be these sectors that drive water use upward.  As a result when evaluating the efficiency of a utility, an analysis should be conducted on the economic sectors to insure that water regulations do not stifle economic growth and jobs in a community.   And conversely if you do not have these sectors, you water use should be lower.  Something to think about when projecting or regulating water use.  Limited water use may in fact be limiting economic activity in the area. Of course if you are water limited, limited new withdrawals may be perfectly acceptable if you want to encourage other options, like direct or indirect potable reuse, irrigation, etc.  

It would be interesting to expand this study across the country to see what the national trends look like and how different tourism oriented South Florida might actually be.


Fred+Bloetscher+Senate+Committee+Holds+Hearing+cQCSwINqgm3l

Water and wastewater utilities spend a lot of time dealing with current issues =- putting out “fires.”  But there are larger trends that will affect the industry.  Here are a couple recent topics that we should consider in our industry:

Will robots be doing all our repetitive jobs?  If so what does that mean for all the people doing those jobs now.  Most do not require a lot of skills, and many of those in the jobs that will be lost, do not have the skills for other jobs?  Does the $15 per hour minimum wage accelerate this transition?  How does this affect the water industry?  Meter readers might be replaced with AMR systems.  Customer service is already migrating to direct banking.  There is a change coming.

What does the driverless car mean for us?  I am thinking about an old Arnold Schwartzenegger movie.  For utilities the issue may be how we interact with unmanned vehicles, especially when what we do can be disruptive to traffic.  What happens if those cars get into an accident?  And Warren Buffett is thinking about the impact of this on the insurance industry.  He owns a lot of GEICO stock.  It is doubtful many utility vehicles will be unmanned, in the near-term, but do our manned vehicles and the potential disruption leave us open to greater risk of loss?

Speaking of Warren Buffett says the economy is far better than certain candidates suggest.  I tend to trust Mr. Buffett.  He’s been doing this a long time and has been fabulously successful.  But he notes structural changes to the economy like those noted above, are ongoing.  That will create conflict for certain professions that migrate to automation, much as manufacturing did in the 1970s.  He raises concern about what happens to those workers and suggests that we have not planned enough for those workers who get displaced as the economy undergoes continuing transitions.  In the late 1970s we had CETA and other jobs training programs as we moved from manufacturing to other jobs.  He does not see that in place now.  The at-risk – the poor, minorities, the less educated, rural citizens…. in other words, the usual groups will be hit harder than the rest of the population.  I don’t hear that discussion on the campaign trail but utilities may want to follow these trends is the hope that we can acquire some of the skillsets that we need.  Or provide that training.

Florida’s flood protection plan received a C- from a study called States at Risk.  It said Florida lacks a long term plan for rising seas, despite being vulnerable.  On an unrelated note, the state is expecting insurance premiums to increase 25% or more for flood insurance for homeowners.  And local officials are working busily on FEMA maps to exclude as many properties as possible from flood insurance requirements.  Maybe those things are all related, just at opposite purposes, but who is going to get the calls when flooding occurs?  Storm water utilities, and sewer systems where the manholes are opened to “facilitate drainage.”  The question is what the ratings are for other states as Florida was not the least prepared nor is it the only state with exposure.

A final current trend to think about is this:  Current sea level rise projections have increase the high end, but remained steady for the 50 percentile case.  By 2200 we may see seas at 10 ft higher. That would be a major problem for south Florida.  But the world population will be over 15 billion, which exceeds the carrying capacity of agriculture (at present projections and techniques).  It also places over half the world in water limited areas.  So sea level rise is going to be huge in south Florida, but will concern be localized because of more pressing issues?   Is the number of people going to be our biggest issue in 2200?  Note both will be critical for a large portion of those 15 billion people, but the solution to either is…..?


photo 2A week or so ago, on a Sunday afternoon, I flew across Middle America to Colorado for a meeting and was again struck by the crop circles that dominate the landscape west of the Mississippi River.  They are everywhere and are a clear sign of unsustainable groundwater use.  I recently participated in a fly in event for National Groundwater Association in Washington DC, where several speakers, including myself, talked about dwindling groundwater levels and the impact of agriculture, power and economies.  The impact is significant. Dr. Leonard Konikow, a recently retired USGS scientist, noted that he thinks a portion of sea level rise is caused by groundwater running off agriculture and from utilities and making its way to the ocean. He indicated that 5% of SLR each year was caused by groundwater runoff, and has upped his estimates in the past 10 years to 13%.  This is because it is far easier for water to runoff the land than seep into rocks, especially deep formations that may take many years to reach the aquifer.  And since ET can reach 4 ft below the surface, many of the western, dry, hot areas lose most of this water during the summer months.  Hence the impact to agriculture, and the accompanying local communities and their economies will be significant.

It should be noted that the US is a major exported of food to much of the world, including China, so the impact on our long-term economic trade may be significant.  Fortunately the power industry has historically preferred surface waters, but must as power demands increase, they have begun to explore groundwater in rural areas without access to surface waters.  Keep in mind that air-cooled power plants are 25% or more less efficient than water cooled systems and many of these communities lack sufficient reusable water supplied to substitute for cooling.  Hence the projection is a long term negative impact on all of us.

So the question is why isn’t the federal government talking more about this problem?  Is it fear of riling up local political officials that see growth at all costs as necessary?  It is private rights arguments that may spawn lawsuits?  Is it a lack of interest in long-term?  Or the idea that “we have always found a way”. Or is it just buried heads in the sand, leaving the next generation to deal with the problem?  A big issue, yet we do not talk enough about it.  Maybe this is not a surprise since we have not gotten very far with the discussion of limited oil, precious metals, phosphorous or other materials, and unlike them, water appears to be renewable globally.  But water is location specific.  If you have it, great.  If you lose it, a problem.  There are several recent journal articles that make the argument that much of the strife in the Middle East and Africa is water depletion related: water depletion kills local economies.  So we need to ask –what happens if we ignore the looming crisis?  Do we create more “Bundy-type” actions in the rural, dry west because they already lack water?  I suggest it is a cause for concern.


For those wondering what the big report was going yo say, interesting reading, and a lot like Walkerton – plenty of blame to go around.

Click to access FWATF_FINAL_REPORT_21March2016_517805_7.pdf

And some related articles:

http://www.fox2detroit.com/news/flint-water-crisis/112311306-story


How to Predict the next Flint?

IMG_4803In the last blog we talked about Flint’s water quality problem being brought on by a political/financial decision, not a public health decision.  Well, the news get worse.  Flint’s deteriorated water system is a money thing as well – the community has a lot of poverty and high water bills, so they can’t pay for improvements.  They are not alone.  Utilities all over the country have increasing incidents of breaks, and age related problems. So the real question then is who are the at risk utilities?  Who is the next Flint?  It would be an interesting exercise to see if a means could be developed to identify those utilities at risk for future crises, so we can monitor them in more detail as a means to avoid such crises.

So what would be the measures that might identify the future “Flint?”  These could be things like age of the system, materials used, economic activity trends, income, poverty rate, unemployment rate, utility size, reserves, utility rates, history of rate increases, etc.?  Could these be developed into a means to evaluate risk?  If so, who would use it and how would we address the high risk cases?  I suggest that lenders have means to evaluate this using many of these same measures, but from a risk of events, this method has not been applied.  So I think this would be a useful research project.  So if anyone has some ideas, time or ideas for funding, let me know.  Let’s get rolling!


I was at a recent AWWA technical and Education Council meeting in Denver. One of the major discussions was the issues with lead service lines as highlighted by the current problem in Flint, and how many utilities are now fielding questions about and dealing with lead in their services lines, research that will come for lead, and regulatory requirements for upgrades. One issue that remains unanswered is what happens on the customer’s side of the meter, which may also be lead piping. So removing the utility’s lead service would not solve the lead issue completely, but it will help. But why has lead not been an issue in 25 years? Did it suddenly arise?
While the lead has arisen again as a public health topic, the lead and copper rule has been in effect for nearly 30 years and much of the lead and copper testing was conducted in the early 1990s. Most utilities made water treatment upgrades based the findings from the testing, and utilities have been required to continue to monitor their system ever since. Normally lead levels, even when present, were not a health issue because the zinc orthophosphates and other treatment methods kept the pipe
encapsulated. Others like Cincinnati, Lansing, Madison, Boston and others had ongoing programs to replace lead pipes. 30 years ago in North Carolina we changed out lead goosenecks and galvanized lines rather than replace them – it was just easier.
Most of the folks in the room agreed most utilities have or have such programs and that the number of lead service lines and lead goosenecks on the utility side is
limited. So I suggested that maybe the lesson we should learn from Flint is not about lead service lines, but instead the risks we incur with decision-makers who only look at money when making decisions. Flint’s decision to change water sources was driven by money, not public health.
In fact the report just published indicates that public health was not a real consideration at all. But decisions based on money impacted not only Flint, but Alamosa, CO in 2008, where disinfection was not practiced, and Walkerton,
ONT in 2001 where a Flint like set of decisions cascaded into contamination that killed people. There are utiity systems who contract operations and their contract operator makes decisions based on money, and now there is a distribution system problem. This is a repetitive pattern that has less to do with personnel operating these systems, than decision-makers, who tend to look more at the business case or money as opposed to public health. The lesson we need to learn is that money cannot be the
deciding factor when operating public water and sewer system. And to reduce the chance it happens in the future, perhaps there should be penalties if it does.

In the last blog I showed what reclaimed wastewater could do for an ecosystem.  Very cool.  But what about for drinking water.  I actually was involved in an indirect potable reuse project several years ago.  The concept was to take wastewater, filter it with sand filters, filter it with microfiltration, reverse osmosis and then hydrogen peroxide and ultraviolet light.  This is what they do in Orange County California when they recharge groundwater, and have been for over 30 years.  Epidemiological studies in the 1990s indicated no increased incidence of disease when that water was withdrawn from the aquifer, and then treated in a drinking water plant before distribution.  So our project was similar – recharge to the Biscayne aquifer in south Florida.   It worked for us.  Total phosphorous was below 10 ppb, TDS was less than 3 mg/L (<1 after RO), and we were able to show 3 log removal of endocrine disruption compounds an d pharmaceuticals.  It worked well.  This is a concept in practice in California.  And will be at some point in south Florida since only the Biscayne aquifer provides sustainable water supplies.  Here is what our system looked like.

IMG_3100

sand filters

IMG_3106

microfiltration

IMG_3085

Reverse osmosis

IMG_3152

ultraviolet/peroxide

This is also the same basic concept Big Springs Texas uses for their direct potable program, demonstrating that the technology is present to treat the water.  A means for continuous monitoring is lacking, but Orange County demonstrates that for indirect potable reuse projects, a well operated plant will not risk the public health.  This is how we do it safely.