Archive

Tag Archives: investment


We have talked about reserves, the need for them, reasons why they are neglected and how to establish appropriate numbers (an area where more research is needed).  Reserves are an issue when the economy tanks.  We all recall the problem in 2008, but this is where utilities need to look beyond just their system to see what might be coming.  2008 was a problem that we should have seen coming, or at least planned for, but did not.  But it means that we need to look at the national and local economic picture and understand a little about events beyond our reach that can affect us.  Utilities and governments generally do not do this well. 

In 2005-2007, it was very clear we had a property bubble going on.  There was discussion on the news, financial channels, Wall Street Journal and even columns by economist like Paul Krugman.  A few of us may have taken advantage of the bubble through prudent real estate sales, but many did not.  Likewise, few utilities or governments planned for its inevitable fall.  After the crunch hit, those who owed the least amount of money, had savings and had stable incomes fared better than those who did not.  Same for governments.  Unfortunately most Americans and most governments fell into the “did not” category. 

So let’s look at a couple issues.  First, we knew there was a bubble and should know that all bubbles pop.  We had the tech stock bubble in the late 1990s.  People on Wall Street knew that the investments had turned to real estate and bankers where busy loaning money out with no interest for two years, no money down, adjustable rate mortgages and the like.  If you owned a computer you were inundated with Countryside and various other folks trying to loan you money.  Or buy your house and pay you an annuity if you were older. 

The reason that these “opportunities” were so prevalent was to help speculators who expected to own the property for short periods of time, or help those who might not have the means to buy time to get the means to support the payments.  All the subsequent financial instruments discussed in books like “Too Big to Fail” come from tools used by bankers to disperse the risk associated with speculators and the risky.  It made money for bankers and investment houses (remember they are private businesses beholden to their private stockholders). 

Like all bubbles, we get caught up in the money being made by speculators (and yes if you invest in the stock market you are speculating).  We try to grab onto the rising instruments to get ahead, but we forget that especially with real estate, the growth overall rate across the nation could only grow at the rate of population growth.  It is basic supply and demand. 

For governments, revenues rise, especially during real estate bubbles.  Some bubbles last for years, which creates a distorted view of the future.  In south Florida, there was a lot of buzz concerning water supply projections and arguments between regulatory staff and utilities over water supplies that were projected 20 years in the future, based on demand projections from 2000-2005.  When the dust settled in 22011, most of those issued disappeared because virtually all projections were substantially revised downward.  And most revenue growth projections were likewise revised downward and capacity needs delayed.  Planning 20 years out is historically inaccurate because the global economy can impact local growth.

Of course these new projections are incorrect as well.  Because the test period was 2005-2010 or 2000- 2010, the growth is stunted.  So they are likely underestimating demand and revenues.  Uncertainty with time means that the accuracy of projection decreases with time.  As a result, simply relying on past projection methods increases risk that of significant deviations.

I do an exercise n class where I give students three sets of projections.  10 years apart, for 50 years.  I tell them nothing else.  The examples are The State of Nevada, Cleveland, and Collier County, FL.  All are in the past (Cleveland is 1910-1950) There is absolutely no easy method that can project the growth in either Collier County or the State of Nevada, or that Cleveland’s population will drop in half. We could do the same with Detroit and never project that decrease either.  But when you tell them where the population are and what year, the wheels start to turn.  They realize that economics is a major issue.  While Nevada and Collier grew from 1960-2000, the rate of change is likely to be very different in 2010 to 2020 due to the 2008 recession. 

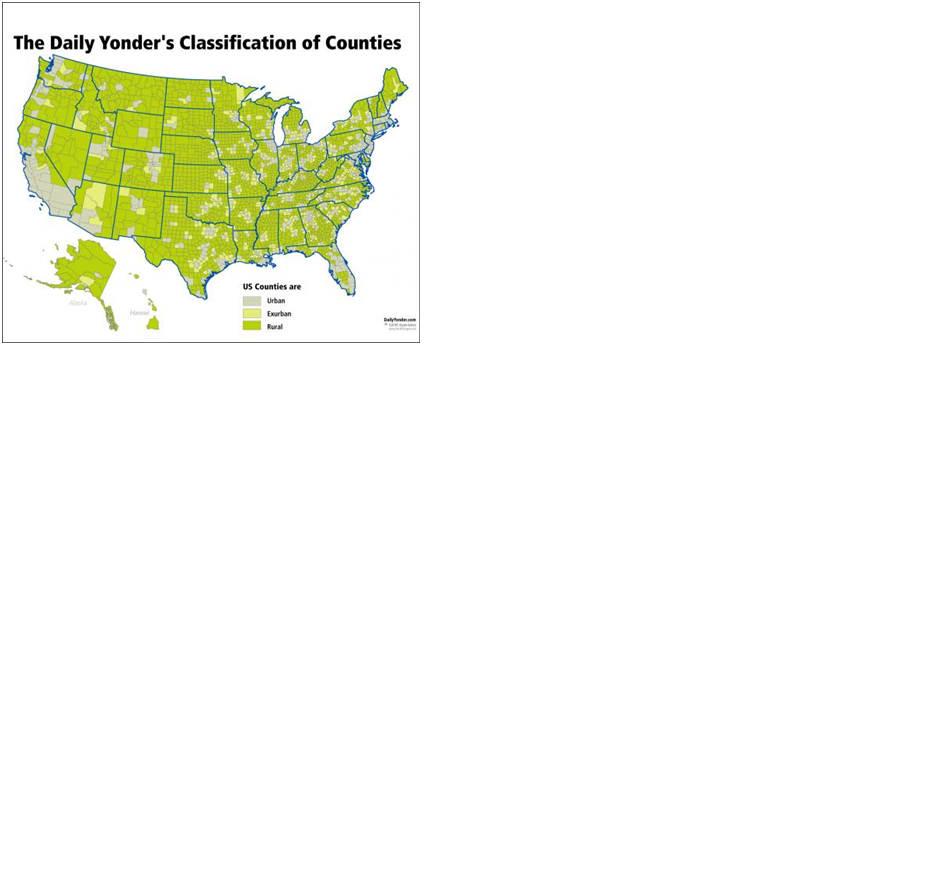
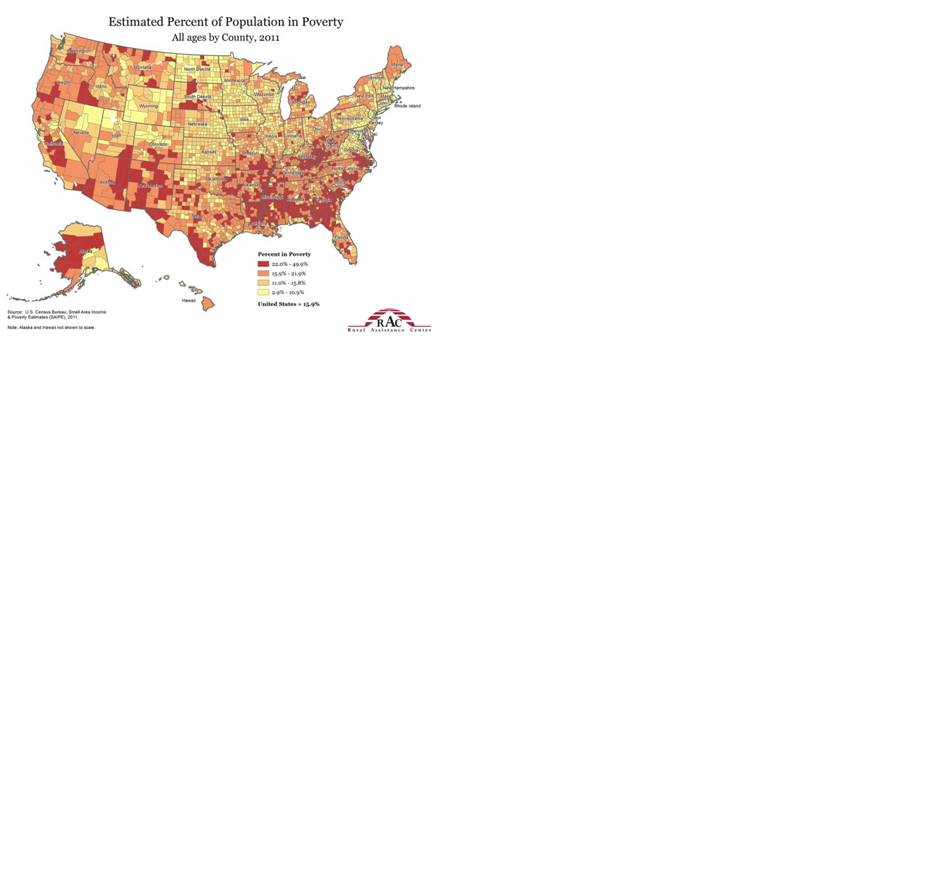
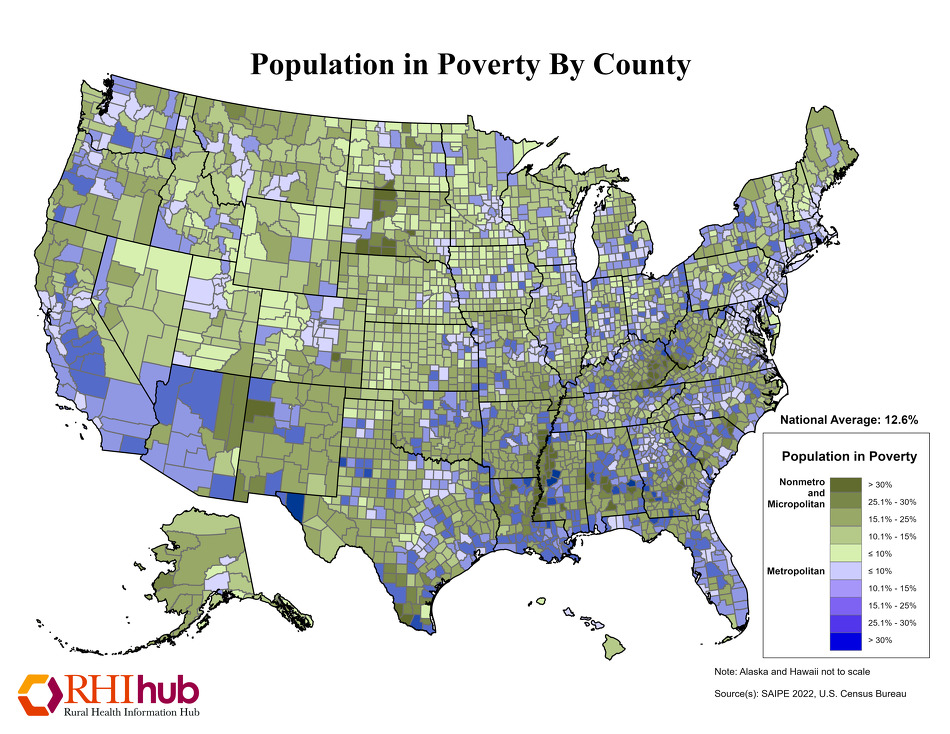
Tracking economic activity is a utility responsibility.  We need to know what is really happening, and understand bubbles.  We need to recognize that when property values and housing number increase fast, it will be short term.  Plan for savings and reserves.  Figure out what your recovery period might be.  We need to understand our economic base.  For example try this out and see what your conclusion is.  Florida’s economy is based on three major industries: agriculture, tourism and housing.  What could possibly go wrong with that model?  Well if we have an economic problem nationally, 2 of 3 take major hits because people outside the state do not travel to Florida and retirements get put off.  The economy gets hit hard and recovery is slow.  We have experienced that exact phenomenon from 2009 to date.  And many of those jobs are low wage positions which means the people who struggle most get hit hardest.  Storm events can impact the state.  Bit hits to all three, and agriculture is also a low wage industry.  It is a precarious economic model that sets itself up for potential fluctuations.  We need to plan for this.  It is our responsibility, utility staff and decision-makers to plan and prepare for the next big event.  

As water and sewer utilities, the public health and safety of our customers is our priority – it is both a legal and moral responsibility. The economic stability and growth of our community depends on reliable services or high quality. The priority is not the same with private business. Private businesses have a fiduciary responsibility to their stockholders, so cutting services will always be preferred to cutting profits. Therein lies the difference and yet the approach is different. Many corporations retain reserves for stability and investment and to protect profits. Many governments retain inadequate reserves which compromises their ability to be stable and protect the public health and safety. Unlike corporations, for government and utilities, expenses are more difficult to change without impacting services that someone is using or expects to use or endangering public health. Our recent economic backdrop indicates that we cannot assume income will increase so we need to reconsider options in dealing with income (revenue) fluctuations. If there are no reserves, when times are lean or economic disruptions occur (and they do regularly), finding funds to make up the difference is a problem. The credit market for governments is not nearly as “easy” to access as it is for people in part because the exposure is much greater. If they can borrow, the rates may be high, meaning greater costs to repay. Reserves are one option, but reserves are a one-time expense and cannot be repeated indefinitely. So if your reserves are not very large, the subsequent years require either raising taxes/rates or cutting costs. An example of the problem is illustrated in Figure 1. In this example the revenues took a big hit in 2009 as a result of the downturn in the economy. Note it has yet to fully return to prior levels as in many utilities. This system had accumulated $5.2 million in reserves form 2000-2008, but has a $5.5 million deficit there after. Reserves only go so far. Eventually the revenues will need to be raised, but the rate shock is far less if you have prudently planned with reserves. You don’t get elected raising rates, but you have a moral responsibility to do so to insure system stability and protection of the public health. So home much is enough for healthy reserves? That is a far more difficult question. In the past 1.5 months of operating reserves was a minimum, and 3 or more months was more common. However, the 2008-2011 economic times should change the model significantly. Many local governments and utilities saw significant revenue drops. Property tax decreases of 50% were not uncommon. It might take 5 to 10 years for those property values to rebound so a ten year need might be required. Sales taxes dropped 30 percent, but those typically bounce back more quickly - 3-5 years. Water and sewer utilities saw decreases of 10-30%, or perhaps more in some tourist destinations. Those revenues may take 3-5 years to rebound as well. Moving money from the utility to the general fund, hampers the situation further. Analysis of the situation, while utility (government) specific, indicates that appropriate reserves to help weather the economic downturns could be years as opposed to months. The conclusion is that governments and utilities should follow the model of trying to stabilize their expenses. Collect reserves. Use them in lean times. Develop a tool to determine the appropriate amounts. Educate local decision-makers and the public. Develop a financial plan that accounts for uncertainty and extreme events that might impact their long-term stability. Take advantage of opportunities and most of all be ready for next time. In other words, plan for that rainy day.


My last blog was a discussion about surpluses.  The State of Florida will have a $1.3 billion surplus this year and a host of politically expedient answers for where that money goes (tax cuts, pork projects, projects to help election results), but little mention of replenishing trust funds and reserves that were emptied to balance the budget amid tax cuts from 2010 – 2012.  But perhaps it is not the legislators or their constituents that we should blame for not understanding the need for reserves because the truth is that most people are not used to saving.  A recent article I read noted that 72 percent of Americans live paycheck to paycheck and would have difficulty putting $2000 together if needed.  $2000 is not a lot of money these days – it won’t buy you a transmission for example or a new engine for your car.  It won’t cover first, last and a deposit on a rental.  And it won’t cover the down payment on a house or most cars.  There are people who do not receive enough income to achieve some degree of savings, but not 72% of us.  We have come to perceive that having little savings is normal, but it wasn’t always this way and it is not this way everywhere in the world.  Back in the day, American saved more than they do now.  The reason is not that they had more money (they didn’t) or that they had less to spend money on (as things cost more proportionately).  But it was that “rainy day” they all knew would come and when they would need money.  They had been through depressions, recession and losses of industries (remember those Concord coachmakers did not get a federal bailout in trying to compete with Henry Ford).  They knew that there would be times when they needed to rely on themselves to survive and savings was the key.

There are two major differences from the past.  The most important is the fact is that credit was a lot harder to come by back in the day, so you needed cash for those big purchases.  That has changed dramatically in 50 years.  Today we get advertisements for credit cards – in the mail, instant credit at stores, easy credit for cars, and in the early 2000s, no-money-down-no-income-verification loans on real estate.  The need to save evaporated.  The access to easy credit has eliminated much of the need to save for those big expenses.  We can borrow to acquire them.  If we have a job problem, we borrow against the house or life insurance policy.  These are good backstops that help us maintain our way of life.

At the same time as we are being extended opportunities to secure funds to spend, we are barraged by advertisements and flyers and pitches to spend that money on products and services, many of which we probably don’t need, but are “cool” to have.  We are encouraged to compete to have better “stuff” than the other guy, and make sure we have the newest technology.  We all do it.  Just look at all phones can do, while keeping in mind that the old Bell phone I bought in college still works regardless of the situation and still sounds good.  No cool ringtones however, nor photo capability.  All that means we spend less on “needs” and more on “stuff.” 

Given this backdrop it is no surprise the attitude of decision-makers in government toward revenues and expenses.  Re-education of the public is needed as opposed to rhetoric.  We need to move the public discussion away from the concept of a balanced budget being expenses equal revenues to the correct concept of revenues + reserve expenses = expenses plus savings.  At times you use reserves (and savings =0) while other times reserve expenses are 0, while savings are positive. When big expenses come, borrow, but recurring expenses should not be funded through borrowing (credit).  We should seek to avoid is the desire to cut taxes (akin to cutting our salaries) to bring the budget back into balance that if we run a surplus, or spend it on “stuff.”  Such a system leaves room for those lean times when revenues may fluctuate but expenses do not (or increase).  


A number of years ago I had the pleasure of speaking with archeaologist Bryan Fagan for an hour or so before a presentation he gave at a conference.   Dr. Fagan is a modern-day Indiana Jones, who has been all over the world studying ancient ruins.  Dr. Fagan expressed his career as “50 years of studying drainage ditches,” but with studying drainage ditches he could provide you with the rise and fall of civilizations through history.  His book Elixir outlines a number of these civilizations:  Egyptian, Babylonia, Southeast Asia, and even the American West.  His findings were that the civilization expended as far as infrastructure could be constructed to allow water to flow to where it was needed, whether that was Alexandria or Ur.  Later civilizations expanded and developed as technology allowed water to flow further.  Rome demonstrated that water could be moved with more than ditches, which would have been a severe limitation for Rome and other civilizations based in dry areas with topography.  The Romans constructed extensive tunnels and aqueducts to supply Rome with water from mountains to the east and north. A recent article noted that we probably know about 20% of the Roman tunnel system as we keep discovering more of it each year – tunnels lost in the Dark Ages after the fall of Rome.  Dr. Fagan notes that it was access to water that allowed human civilizations to develop and evolve.  It is why a number of engineering organizations like Water for People and Engineers Without Borders focus their efforts on providing access to clean water to people in Third World countries.  It is their only way to get to the modern world.  All other infrastructure:  roads, major buildings, etc., result from the access to clean water that allows people to be healthy and productive.

So if civilization rises and falls with access to water, why is it so hard to get public officials to fund water supply and rehabilitation projects?  We talk of an infrastructure crisis in the United States because our average water and sewer infrastructure systems are working on 50 years old and deterioration is evident.  We have many mid-western communities with water, but no customers to pay for deteriorating infrastructure (Detroit), and southeastern utilities that have lost factories that supported the bulk of their utility, and insufficient growth in the customer base to deal with operations and maintenance.  As a result, outages and breaks occur more frequently, costing more money to repair, but under the auspices of maintaining rates, the revenues do not increase to support the needed repairs. 

At least the southeast has surface supplies, albeit perhaps limited, which constrains growth (Atlanta), but our fastest growth often occurs in areas we know have limited precipitation, like a lot of the American West.  Yet somehow we expect groundwater sources that do not recharge locally, to sustain the community indefinitely without disruption – ignoring the fact that history tells us communities cease to function when water supplies are exhausted.  USGS identified many areas that have long-term permanent declines in aquifers as a result of pumpage for agricultural and community uses.  No one raises the question about the aquifer levels – permits get issued, but little data is gathered and very limited plans are available in most places to deal with the declines.  And no one raises a question about aquifer levels because stopping growth to deal with water supplies is not in conformance with the desire to grow, which is required to support additional services demanded by the community. 

No one questions how to secure the water either, much of which has been “created” by federal tax dollars spend over 50 years ago during the era of great dam building (1920-1960).  However, as these systems and populations age, the concern about costs will continue to engender discussion.  And hand wringing.  Water costs money.  Water creates civilization and sustains it.  When we take it for granted, it becomes all too easy to fall behind the proverbial “eight-ball,” and the system crashes.  It is a testament to the utility personnel – the managers, engineers and operators – that these systems continue to operate as they do.  But bailing wire and duct tape only go so far.  We need to develop a frank discussion about the need to infuse funds – local, federal, state and private – into addressing our infrastructure needs.  The dialog needs to commence sooner, as opposed to after failure. 


Several weeks ago we looked at the phenomenon of population, income, education and unemployment.  The impact to from the combination of these factors in certain communities can be difficult.  Let’s explore a little further as there is more, interesting data every day.  The US Department of Agriculture is releasing its report of rural America.  The findings are interesting and counter-intuitive to the understanding of voters in many of those communities.  Their findings include:

  • The rural areas grew 0.5 % vs 1.6% in urban areas from mid-2011-mid 2012
  • Rural incomes are 17% lower than urban incomes.
  • The highest income rural works (95th percentile) earn 27% less than their urban counterparts
  • 17.7% of rural constituents live in poverty vs 14.5% in urban areas
  • 80% of the high poverty rate counties were rural
  • All the high income counties are urban.

Wow!  So the ghetto has move to the country? According to these statistics there is truth in that statement.  Let’s look a little further using some on-line mapping. 

First let’s look at where these rural counties are.  Figure 1 is a map from www.dailyyonder.com  that shows (in green) the rural counties in the US.  Wikipaedia shows the 100 lowest income counties in Figure 2.  For the most part, these counties are rural, with the exceptions being a few areas in south Texas and in the Albuquerque/Santa Fe area of New Mexico. Raceonline.com shows the populations in poverty by county.  The red areas are the highest poverty rates.  The red areas in Figure 3 expand Figure 2 to include much of the rural deep south, Appalachia, more of Texas and New Mexico and part of the central valley in California.

Figure 4 shows how the number of young people has changed between 2000 and 2009 in rural counties (urban counties are white and not included – red means a decrease).  Figure 5 shows population growth (or not) by county. What you see in these two maps is that the young people are moving to the rocky mountain states and vacating the high poverty counties in Figure 3.  Yong people do not see jobs in the rural area – unemployment is 20% higher in rural America and the jobs that are there pay less.  Figures 6 and 7 show unemployment by County in 2008 after the start of the Great Recession and in 2013.  What these figures show is that with exception of the Plains states and Rockies, is that many of the areas with high poverty also had high unemployment, and that the unemployment has remains stubbornly high in many rural areas in the Deep South, Appalachia and New Mexico, plus high unemployment in parts to  the Great Lakes, but the poverty rates are still lower.  Education may by a factor in why the Plains states and Rocky Mountains have less unemployment – despite being rural their students are far more likely to graduate from high school than those in the deep South, Appalachia where unemployment remains high and incomes low. 

So what does this possibly have to do with utilities?  Utilities need to understand this problem as is demands some real, on-the-ground leadership.  Small and rural utilities are more costly to operate per thousand gallons than larger utilities.  A 1997 study by the author showed that economy-of-scale manifested itself to a great extent with water and wastewater operations.  The differences were not close – it is a lot less costly to operate large utilities vs small ones.  Rural utilities complicate the issue further because not only is the number of customers limited, but the pipe per customer is less so the capital investment per customer is far higher than in urban areas.  The impact is that utilities are under pressure to reduce rates to customers, or create a set of lower cost rates for those in poverty, while at the same time their costs are increasing and infrastructure demands are incrementally higher than their larger neighbors.  The scenario cannot be sustained, especially when large portions of rural infrastructure was installed with FHA grants, meaning the customers never paid for the capital cost in the first place.  There was no or lower debt, than what larger utility customers have.  The rural rates since these investments have been set artificially lower than they should as a result. But with Congress talking about reducing SRF and FHA programs, FHA is unlikely to step in to replace their initial investment, meaning that the billions of rural investment dollars that will be needed in the coming years will need to be locally derived, and rate shock will become a major source of controversy in areas that are largely very conservative politically and tend to vote against projects that will increase costs to them.

The good news is that much of the rural infrastructure may be newer when compared to much of the urban infrastructure.  So there is time to build the argument that local investment is needed.  The community needs to be engaged in this discussion sooner as opposed to when problems occur.  Saving for the infrastructure may be the best course since rural utilities will have limited access to the borrowing market because of their size, but that means raising rates now and keeping those saved funds as opposed to using them to deer rate increases.  If ongoing efforts in the House deplete federal funding further, the pinch will be felt sooner by rural customers who will lose the federal dollars from SRF and FHA programs. 


Image

Figures 1 – Rural Counties

The United States: By Rural, Urban and Exurban Counties


Image


Figure 2.  100 lowest income Counties in the US


http://en.wikipedia.org/wiki/List_of_lowest-income_counties_in_the_United_States


Image

Figure 3.  Estimated population in poverty

http://www.raconline.org/racmaps/mapfiles/poverty.jpg


Image

Figure 4.  Where the Young People Are

http://www.raconline.org/maps/topic_details.php?topic=55


Image


Figure 5.  Where people are moving to http://www.raconline.org/maps

Image


Figure 6  Unemployment 2008

http://en.wikipedia.org/wiki/Unemployment

Image

Figure 7  Unemployment 2013 http://www.huduser.org/portal/pdredge/pdr_edge_featd_article_040


As 2014 is only a month away, expect water and sewer infrastructure to become a major issue in Congress.  While Congress has failed to pass budgets on-time for many years, already there are discussions about the fate of federal share of SRF funds.  The President has recommended reduction in SRF funds of $472 million, although there is discussion of an infrastructure fund, while the House has recommended a 70% cut to the SRF program.  Clearly the House sees infrastructure funding as either unimportant (unlikely) or a local issue (more likely).  Past budgets have allocated over $1.4 billion, while the states put up a 20% match to the federal share.  A large cut in federal funds will reverberate through to local utilities, because many small and medium size utilities depend on SRF programs because they lack access to the bond market.  In addition, a delay in the budget passage due to Congressional wrangling affects the timing of SRF funds for states and utilities, potentially delaying infrastructure investments. 

This decrease in funding comes at a time when ASCE rates water and wastewater system condition as a D+ and estimates over $3 trillion in infrastructure investment will be needed by 2020.  USEPA notes that the condition of water and wastewater systems have reached a rehabilitation and replacement stage and that infrastructure funding for water and sewer should be increased by over $500 billion per year versus a decrease of similar amounts or more.  Case Equipment and author Dan McNichol have created a program titled “Dire Straits:  the Drive to Revive America’s Ailing Infrastructure” to educate local officials and the public about the issue with deteriorating infrastructure.  Keep in mind much of what has made the US a major economic force in the middle 20th century is the same infrastructure we are using today. Clearly there is technical momentum to indicate there is greater need to invest in infrastructure while the politicians move the other way.  The public, caught in the middle, hears the two sides and prefers less to pay on their bills, so sides with the politicians as opposed to the data. 

Local utilities need to join the fray as their ability to continue to provide high quality service.  We need to educate our customers on the condition of infrastructure serving them.  For example, the water main in front of my house is a 50 year old asbestos concrete pipe that has broken twice in the past 18 months. The neighborhood has suffered 5 of these breaks in the past 2 months, and the City Commission has delayed replacement of these lines for the last three years fearing reprisals from the public.  Oh and the road in front of my house is caving in next to where the leak was.  But little “marketing” by the City has occurred to show the public the problem.  It is no surprise then that the public does not recognize the concern until service is interrupted.  So far no plans to reinitiate the replacement in front of my house.  The Commission is too worried about rates.

Water and sewer utilities have been run like a business in most local governments for years  They are set up as enterprise funds and people pay for what they use.  Just like the private sector.  Where the process breaks down is when the price is limited while needs and expenses rise.  Utilities are relatively fixed in their operating costs and I have yet to find a utility with a host of excess: workers.  They simply do not operate in this manner.  Utilities need to engage the public in the infrastructure condition discourse, show them the problems, identify the funding needs, and gain public support to operate as any enterprise would – cover your costs and insure you keep the equipment (and pipes) maintained, replacing them when they are worn out.  Public health and our local economies depend on our service. Keep in mind this may become critical quickly given the House commentary.  For years the federal and state governments have suggested future funding may not be forthcoming at some point and that all infrastructure funding should be local.  That will be a major increase in local budgets, so if we are to raise the funds, we need to solicit ratepayer support.  Now!  


In the field of engineering, the concept of sustainability refers to designing and managing to fully contribute to the objectives of society, now and in the future, while maintaining the ecological, environmental, and economic integrity of the system.  Most people would agree that structures such as buildings that have a lifespan measured in decades to centuries would have an important impact on sustainability, and as such, these buildings must be looked at as opportunities for building sustainably. When people think about green buildings, what generally comes to mind is solar panels, high efficiency lighting, green roofs, high performance windows, rainwater harvesting, and reduced water use.  This is true, but building green can be so much more.

The truth is that the built environment provides countless benefits to society; but it has a considerable impact on the natural environment and human health (EPA 2010). U.S. buildings are responsible for more carbon dioxide emissions annually than those of any other countries except China (USGBC 2011). In 2004, the total emissions from residential and commercial buildings were 2,236 million metric tons of carbon dioxide (CO2), more than any other sector including the transportation and industrial sectors (USGBC 2011). Buildings represent 38.9% of U.S. primary energy use,72% of U.S electricity consumption (and 10% worldwide), 13.6% of all potable water, and 38% of all CO2 emissions (USGBC 2011).  Most of these emissions come from the combustion of fossil fuels to provide heating, cooling, lighting, and to power appliances and electrical equipment (USGBC 2011). Since buildings have a lifespan of 50 to 100 years during which they continually consume energy and produce carbon dioxide emissions, if half of the new commercial buildings were built to use only 50 percent less energy, it would save over 6 million metric tons of CO2 annually for the life of the buildings. This is the equivalent of taking more than one million cars off the roads each year (USGBC 2011).

The United States Green Building Council (USGBC) expects that the overall green building market (both non-residential and residential) to exceed $100 billion by 2015 (McGraw Hill Construction 2009).  Despite the economic issues post 2008, it is expected that green building will support 7.9 million U.S. jobs and pump over $100 million/year into the American economy (Booz Allen Hamilton, 2009). Local and state governments have taken the lead with respect to green building, although the commercial sector is growing.

Green building or high performance building is the practice of creating structures using processes that are environmentally responsible and resource efficient throughout a building’s life cycle, from site to design, construction, operation, maintenance, renovation, and deconstruction (EPA 2010). High performance building standards expand and complement the conventional building designs to include factors related to: economy, utility, durability, sustainability, and comfort. At the same time, green building practices are designed to reduce the overall impact of the built environment on human health and use natural resources more responsibly by more efficiently using energy, water, and other resources, while protecting occupant health and improving employee productivity.

High Performance Buildings are defined by incorporating all major high performance attributes such as energy efficiency, durability, life-cycle performance, natural lighting, and occupant productivity (EPA 2010). High performance buildings are constructed from green building materials and reduce the carbon footprint that the building leaves on the environment. A LEED-certified green building uses 32% less electricity and saves around 30% of water use annually (USGBC 2011). Building owners know that there is a return on investment of up to 40% by constructing a green building as a result of savings to energy and water (NAU 2012).

The cost per square foot for buildings seeking LEED Certification falls into the existing range of costs for buildings not seeking LEED Certification (Langdon, 2007).  An upfront investment of 2% in green building design, on average, results in life cycle savings of 20% of the total construction costs – more than ten times the initial investment (Kats, 2003), while building sale prices for energy efficient buildings are as much as 10% higher per square foot than conventional buildings (Miller et al., 2007). At the same time, the most difficult barrier to green building that must be overcome includes real estate and construction professionals who still overestimate the costs of building green (World Business Council, 2008).

New data indicates that the initial construction cost of LEED Certified buildings can sometimes cost no more than traditional building practices.  A case study done by the USGBC showed that the average premium for a LEED certified silver building was around 1.9% per square foot more than a conventional building.  The premium for gold is 2.2% and 6.8% for platinum.  These numbers are averaged from all LEED-registered projects, so the data is limited, but demonstrates that in some cases it does not cost much extra to deliver a LEED certified project which greatly improves the value of the building and lowers operating costs (Kuban 2010).  The authors’ experience with the Dania Beach nanofiltration plant indicated the premium was under 3% to achieve LEED-Gold certification compared to standard construction.

So the question is, why don’t we see more green buildings?  We know water plants can be green (Dania Beach Nanofiltration Plant), but that was the first nanofiltration plant in the world to be certified Gold.  The SRF programs prioritize green infrastructure – so why do more people not pursue them?  It may be an education process.  Or maybe the market just has not caught up.  CIties and states are leading the way here.  Utilities may want to look at this as well.Image


Communicating effectively in both written form and public speaking is critical for the success of the utility.  I have been reading several books on leadership and communication remains an ongoing issue throughout.  We see many schools trying to incorporate this into the engineering curriculum, but that leaves far too many outside the training “program.”  The problem is that many people think they communicate well, when in fact they do not.  Nothing is  more of a reality check than college students, too many of which write in “text message form” as opposed to real written words.  Presenting utility concepts and ideas to different audiences is an integral part of the profession and unfortunately the technical nature of many of our issues requires technical people to communicate concepts to non-technical audiences.  This s far more difficult than it appears, which is part of why the message may be lost.  .Knowing this fact, aspiring utility employees must become familiar with using visual aids and computer-based tools to convey the important design details, so that, the client, regulators, politicians, the public and even other engineers can envision what the final product will look like and evaluate their ability to successfully execute the project. 

We tell our students that technical communication for civil engineers is essential to the profession and is a prerequisite for a successful engineering career. It assists in conveying information, serves as a thought process tool, and is arguably just as essential as excellent analytical or computational skills. For some, writing well comes naturally, for others, it can be a struggle. The difference can be experience, confidence, and proper planning. Planning makes writing easier. A good place to start would be to make an outline of topics to adequately cover the necessary content and in the appropriate order that allows the reader to follow along in a logical fashion. Of course too many of them resist outlines and read very little.  

Reading and writing go hand in hand.  If you read a lot, you have a better chance of being a good writer than those o do not.  The saving grace of the vampire books, Hunger Games, Game of thrones and 50 Shades series is that someone is actually reading the books. That is a first step.  Of course the news is another matter.  History, of course no so much.  For utility folks, it is technical materials that must be read, digested and conveyed to the ratepayers.  People are naturally suspicious of those they cannot understand, a huge barrier for the industry to overcome. I remind our students than when the general public is asked what engineers do, more than half answer:  drive trains.  Wow.  the disconnect!

It is important to avoid overly long documents with too much technical detail, jargon or specialized terms, distractions and tangents.The consequences of poor communications clearly justify the amount of time and effort required to write well because, for example, the written word in a document is permanent; therefore, the bad impression left with the reader of sloppy work can be extremely damaging.  We need to engage the public in a positive way.  Communication needs to be a more robust goal for all of us than it currently is to engender that needed support.


One of the more interesting issues in Congress the past years is the Farm Bill which did not pass the House.  The issue was too many food stamp recipients.  The program has doubled in the past 10 years and now 1 in 7 families depend on supplemental assistance.   But here is an interesting question – wouldn’t you assume that the states with the greatest percentage of people getting food stamps would be those states that voted for the Farm Bill.  That would be those Democratic states like California, Colorado, the New England States, Pennsylvania and New York?  Well interestingly enough, you would be wrong.  The state with the highest percentage of people receiving food stamps is Alabama, followed by New Mexico and Tennessee, which are red states.  In fact all of the southeastern states are in the upper two third, all exceeding 15% of households.  Yet their representatives voted against their constituents!  This should not be a surprise.  All of the “blue” states, except Washington and Oregon were below 15%.  Some were below 10%. 

So how does this affect water and sewer systems?  There is an ongoing effort at the EFC at UNC Chapel Hill and other areas regarding the concept of affordability of water and sewer services.  The concept is that costs in excess of 3.5 or 4.5 % of income may be burdensome on residents.  Effort is trying to come up with ideas to address low income ratepayers.  The loss of food stamps actually exacerbates this problem since most of these same ratepayers are the ones receiving food stamps.  The conflict between paying for food and water/sewer service increases, putting more low income residents at risk.  Congress is doing utilities no favors by disrupting embedded programs that people depend on.  We can debate whether the program, a transfer of funding from wealthier, blue states, to poorer, red states is a appropriate federal revenue transfer, but the reality is that the dependency has been created.  Compounding the problem is that employment is not nearly back to 2007 levels, and salaries for most of us have declined with respect to buying power over the past 30 years.  As a result, many residents, including many hardworking, employed residents, continue to struggle.  We should be concerned about the acts of Congress and remember some of our representatives may not be voting to help their constituents.  


I went to Colorado in July, and it was bone dry like I noted in a prior blog.  The trend was expected to continue, but then something happened.  It rained.  A lot. It’s been raining for almost a month.  Last week it was wet out there, really wet, devastatingly wet on the east side of Rocky Mountain National Park (Boulder, Estes Park, Longmont, Lyons). The rain has not really let up so mountain streams are over-running their banks, flooding streets, washing away bridges, damaging property and businesses.  Helicopter evaluation of the damage indicates that miles of roadways are badly damaged. Route 34/36, the primary eastern entrance to Rocky Mountain National Park may have 17 miles (of 20) damage pavement and foundation needing immediate repair.  Estes Park is cut off from the world and there was mud in the streets.  Rocky Mountain National Park is closed to allow access from Grand Lake for emergency vehicles, residents and supplies.  And eastern emergency route from Nederland is also available.  Tourism has halted in the peak of Fall tourist season.

How fortunes have changed, and continue to change.  Three years ago it was the west side of Colorado with 300 inches of snow that flooded downstream communities.  Three months ago was drought. Are these changes part of a larger issue, or a continuation of the status quo?  Hard to know, but certainly both events were far above any prior events experienced in the area.  The local infrastructure was not constructed to meet these conditions, so either the climate is changing, our models are wrong, or both.  We see the same issue playing out regularly around the world when the 100 year or 500 year storm event occurs and wreaks havoc on a community which does not have infrastructure planned for events like this.

 Expect NE Colorado to be a federal disaster area.  Expect billions to be spent on reconstruction of roadways.   But the larger question is whether the new, replacement infrastructure will survive a similar, or larger climate event in the future.  Will our infrastructure planning be short sighted or will it be adjusted accordingly?  The potential for us to protect infrastructure, and property is completely related to our ability to adjust to infrastructure needs and to minimize exposure to weather events.  Keep in mind our economy and way of life is directly related to our infrastructure condition.  But people want to live near rivers and streams, but rarely consider the real risk and consequences. 

How do we address these risks?  FEMA evaluates the probability of flooding to set flood insurance, but FEMA does not prevent construction in flood zones.  Where construction can occur is a state or local issue.  Of course, few local entities want to limit development in any way, so we keep putting people at risk.  Local officials, like those in Florida, keep pushing FEMA officials to reduce flood risks, despite evidence of increasing rainfall intensity that would increase flooding.  Florida is not alone.  No doubt Colorado officials have the same views.  We need to impress upon local officials the risks and encourage them to reduce risks to citizens.  It’s our tax money and insurance premiums they are raising.  But they are rarely held accountable.  Nor are non-elected officials.  Somehow, this needs to change.  We need leaders to stand up and draw the  line in the sand.