
Taxes, Revenues and the Economy
This is a good time to talk a little economics. I brought up the Laffer curve last week. LEt’s see what a little research can do.
The federal government has two very misunderstood issues. First, while the federal budget has increased with time, the number of employees has actually fallen. The reason, aside form spending for Medicare and social security, is that most of the work is actually contracted to the private sector. Hence federal spending spurs the private economy and the GDP of the country. That appears to be the case as reported by leading economists for the past year. So as an experiment, let’s look at the economy (as measured by GDP), the tax rates, and tax collections rom income tax as a means to see how well “trickle down economics” works. The first ask is the data- the data to use is GDP (nominal and real, highest income tax rate, income tax and total federal receipts, and inflation by year). The federal government publishes this data from 1934 to date (2017 is the last complete year). The next step is graphing.

Figure 1 – Top Income Tax rate 1934 to date
Next, let’s take a look at the GDP with time – There is a lot of ups and downs, although they appear to have been somewhat attenuated as the Federal Reserve exercised more control over the monetary supply and policy. The overall growth rate is decreasing with time.
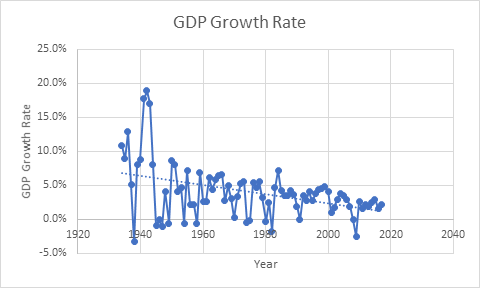
Figure 2 – Change in GDP with time.
Next, let’s look at a map of the income tax rate for the highest bracket. It is easy to see that this rate has been as high as 91% and that there is some correlation in the graph with higher tax rates and a stronger economic growth.

Figure 3 – comparison of top tax rate and the increase in GDP 1934-date
The years versus the percent of GDP that is personal income tax is outlines in the next graph. There are downward spikes that occur. There are spikes up and down, and although a little hard to see, what you can see is that 1963, 1982, 1989, 2002 and 2008 were all years when the growth rate dropped. It should be noted that those were all years when the tax rates were decreased by Congress and the President. There were prior drops that were related to other issues in 1970-76.
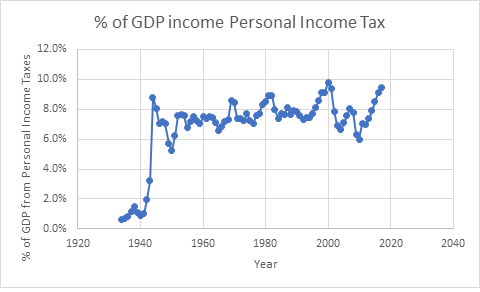
Figure 4 – Change in GDP compared to % of GDP that is personal income tax collections
However, overall, the trend in personal income tax receipts is climbing, except after tax cuts in 2001 and as a result of the 2008 fiscal and banking crisis.
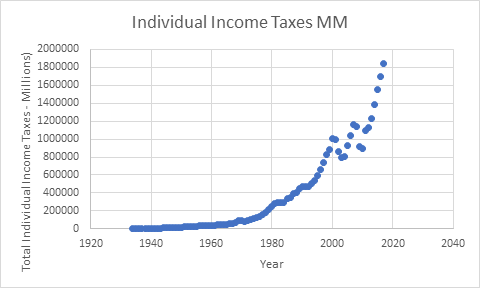
Figure 5 – total personal income tax collections with time
The compares the growth in GDP with the percent of taxes raised by federal income taxes as a percent of GDP. There are two arguments to a result – lower taxes mean sore GDP due to private investing, or lower taxes means less tax revenue with little impact on the GDP. There is a slight trend in this analysis for lower percent of taxes and higher rate of GDP growth, but that is still not the argument made by Laffer.
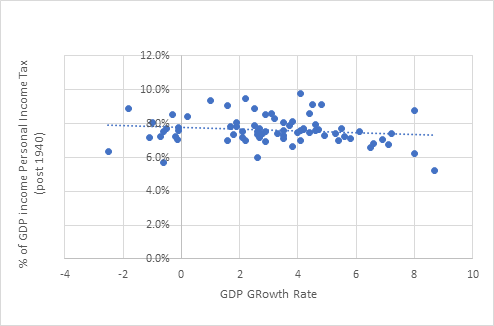
Figure 6 – Comparison of GDP Growth Rate to Personal Income Tax collections as a percent of GDP
Next is a graph of the percent of GDP that is personal income tax receipts as a percentage of GDP versus the maximum income tax rate (post 1940). The graph shows that the percent of GDP that is personal income taxes decreases slightly as the tax rate climbs, which seems to support Laffer and the Trickle-down arguments. But their question really is this – do lower tax rates spur spending. For that we need a final graph.
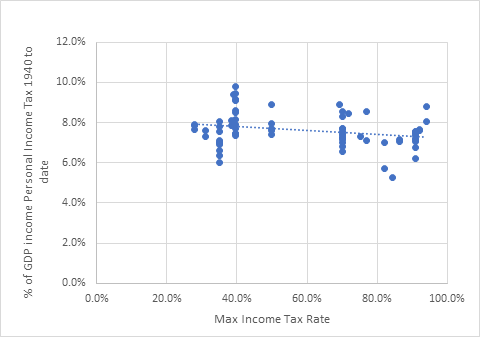
Figure 7 – Maximum Tax Rate to Personal Income Tax collections as a percent of GDP
The argument is that the income tax rate impacts the GDP. Laffer’s argument for lower tax rates was that there would be more taxes (perhaps a slight trend, excluding all other data) and that the economy would boom due to investment by the private sector (trickle down economics). If so, the salient data analysis should be that there is a major increase in GDP as tax rates are lowered from the highest levels. However, the facts disprove this argument – there is a tendency for the overall GDP to increase when the tax rates are highest – exactly the opposite of what the trickle down political pundits in Washington tell you. In fact, higher tax rates and higher GDP are correlated. Figure 8 shows this quite clearly. So should taxes be higher? Maybe – at least if we want to balance the budget in some manner. Clinton seemed to find the right point when the economy boomed in the late 1990s – tax collections increased and the budget was balanced, but the argument that tax rates impact the economy are not as simplistic as argued in Washington. In contrast, it does appear that tax cuts appear to negatively impact both the economy and tax revenues – something not unexpected but largely ignored by the Trickle-down crowd.


Figure 8 Comparison of Maximum Tax Rate to Growth in GDP (Laffer’s Graph) vs the Laffer Curve – the Laffer curve is clearly not correct compared to the actual data
On the other hand, there is a very strong relationship between population growth and the GDP – are argument long made by economists is that the economy can only ultimately increase due to population growth or economic efficiencies (automation). So maybe the answer is to let more people into the US – maybe that will increase the economy, assuming they make enough to pay taxes (47% of Americans do not earn enough to pay anything other than Social security and Medicare taxes which the wealthy largely do not pay). Politically this creates a lot for local officials to think about. Regionally, there are significant social and societal implications. Where large portions of the population do not able to pay taxes, that means challenges for paying for local infrastructure.

Figure 9 – Population increase vs GDP Growth Rate
