Over the holidays there were a couple articles that came out about groundwater issues in the US, mostly from the declining water level perspective. I also read a paper that suggested that rising sea level had a contribution from groundwater extraction, and of course USGS has maps of areas where the aquifer have collapsed as a result of overpumping. In 2009 USGS published a report that showed a large areas across the country with this issue. The problem is that of the 50,000 community water systems in the US, 500 serve over 50% of the population, and most of them are surface water plants. There are over 40,000 groundwater systems, but most are under 500 customers. Hence, groundwater is under represented at with the larger water associations because the large utilities are primarily surface water, while the small systems are groundwater. AWWA has difficulty reaching the small systems while RWA and NGWA reach out to them specifically. But the small utility seems more oriented to finding and producing water and operating/maintaining/drilling wells than the bigger impact of groundwater use. It is simply a matter of resources. I ran a system like that in North Carolina, and just getting things done is a huge issue. A couple of my medium size utility clients have the same problem.
The bigger picture may contain the largest risk. Changing water supplies is a high cost item. We have seen a couple examples (surface water) as a result of drought. We saw Wichita Falls and Big Springs TX go the potable reuse route due to drought. California is looking at lots of options. Both have had rain lately (Wichita Falls discontinued the potable reuse when the reservoir got to 4% of capacity). Great, but someone is next. Droughts come and go, and the questions is how to deal with them.
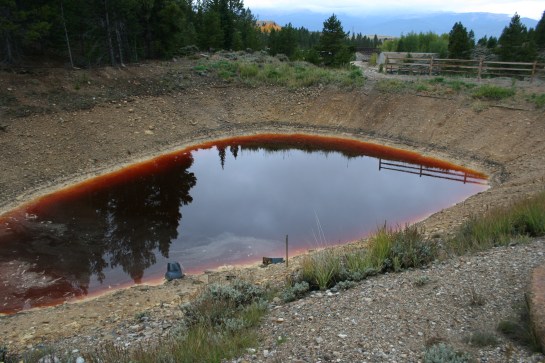
Groundwater supposedly is a drought-proof problem, but is it? Groundwater has been a small utility solution, as it has been for agriculture. But aquifer require recharge and water limited areas do not have recharge. The result is a bigger problem – overpumping. Throughout the west/southwest, Plains states, upper Midwest (WI, MN, IA), southeast (SC, NC), we see this issue. Most of these areas have limited surface water so never developed much historically. Rural electrification changes that because it made is easy to put in an electric pump to pull water out of the ground in areas that never had a lot of water on the surface, and hence were not farmed much. Pumps made is easier to farm productively, which led to towns. However, our means to assess recharge are not very good, especially for confined aquifers. The lowering water levels USGS and state agencies see is an indication that recharge is normally over estimated giving a false picture of water availability. If your aquifer declines year after year, it is not drought – it is mining of the aquifer. You are sucking it dry like the eastern Carolinas did. But, like many negative things, there is a lack of willingness to confront the overpumping issue in many areas. There are many states with a lack of regulations on groundwater pumping. And I still think groundwater modeling use is limited to larger utilities, when smaller, rural systems may be most in need of it due to competing interests.
Concurrently, I think there is a tendency to oversell groundwater solutions (ASR, recharge), groundwater quality and the amount of available water (St George, UT). Easy, cheap, limited treatment should not be the only selling point. That leads to some curious decisions like some areas of California north of LA the utilities do not treat hard groundwater – then tell residents they cannot use softeners because of the salt in the wastewater prevents it from being used for reuse. The reason they do not treat – cost, but it makes things difficult for residents. The fact is we do not wish to confront is the realization that for many places, groundwater should probably be the backup plan only, not the primary source.
That leads to the question – what do we do about it when every politician’s goal is for their community to grow? For every farmer to grow more crops? But can they really grow sustainably? DO we not reach a point where there are no more resources to use? Or that the costs are too high? Or that competition become unruly? The growth and groundwater use ship is sailing, but in to many cases they do not see the rocks ahead.

 In the last blog we talked about Flint’s water quality problem being brought on by a political/financial decision, not a public health decision. Well, the news get worse. Flint’s deteriorated water system is a money thing as well – the community has a lot of poverty and high water bills, so they can’t pay for improvements. They are not alone. Utilities all over the country have increasing incidents of breaks, and age related problems. So the real question then is who are the at risk utilities? Who is the next Flint? It would be an interesting exercise to see if a means could be developed to identify those utilities at risk for future crises, so we can monitor them in more detail as a means to avoid such crises.
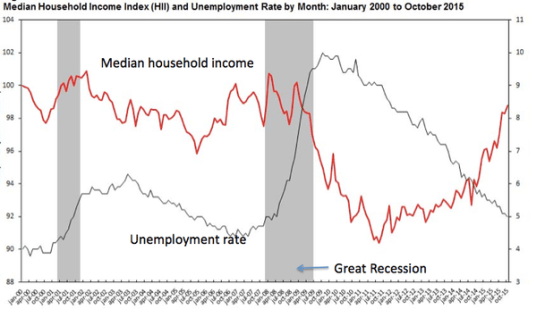
 One of the issues I always include in rate studies is a comparison of water rates with other basic services. Water always comes in at the bottom. But that works when everyone has access and uses those services. Several years ago a study indicated that cable tv was in 87-91 % of home. At the time I was one of the missing percentage, so I thought it was interesting. However, post the 2008 recession, and in certain communities, this may be a misplace comparison. A recent study by Emmanuel Saez and Gabriel Zucman notes that the top 0.1% have assets that are worth the same as the bottom 90% of the population! Yes, you read that correctly. Occupy Wall Street had it wrong. It’s not the 1% it is the 0.1%. This is what things were like in the 1920s, just before the Great Depression. The picture improved after the implementation of tax policies (the top tax rate until 1964 was 90% – yes you read that right – 90%). Then the tax rate was slowly reduced to deal with inflation. The picture continued to improve until supply side economics was introduced in the early 1980s when the disparity started to rise again (see their figure below), tripling since the late 1970s (you recall the idea was give wealthy people more money and they would invest it in jobs that would increase employment opportunities and good jobs for all, or something like that). Supply side economics did not/does not work (jobs went overseas), and easy credit borrowing and education costs have contributed to the loss of asset value for the middle class as they strove to meet job skills requirements for better jobs. In addition wages have stagnated or fallen while the 0.1% has seen their incomes rise. The problem has been exacerbated since 2008 as they report no recovery in the wealth of the middle class and the poor. So going back to my first observation – what gets cut from their budget, especially the poor and those of fixed pensions? Food? Medicine? Health care? My buddy Mario (86 year old), still works because he can’t pay his bills on social security. And he does not live extravagantly. So do they forego cable and cell phones? If so the comparison to these costs in rate studies does not comport any longer. It places at risk people more at risk. And since, rural communities have a lower income and education rate than urban areas, how much more at risk are they? This is sure to prove more interesting in the coming years. Hopefully with some tools we are developing, these smaller communities can be helped toward financial and asset sustainability. But it may require some tough decisions today.