
Federal money – just for giggles
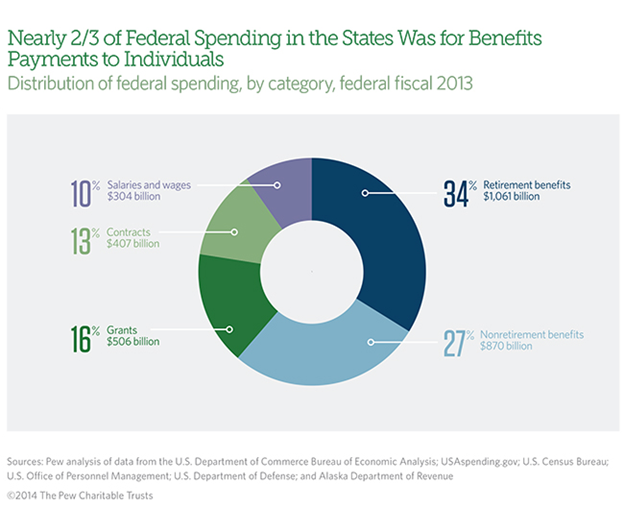
How much money goes to the states from the Federal government? Ever wonder about that? And how do we react? We talk about the need to tighten the federal spending so we keep cutting back on the Superfund cleanup monies ($1 billion/yr), the State Revolving Fund loan system ($2.35 billion/yr), and under $2 billion/yr for clean energy systems. We are concerned about the projected increase of $66 billion/yr for the Affordable Care Act. But these sums are just a tiny component for the federal budget, which is dwarfed by the $3.1 trillion sent to the states during its 2013 fiscal year. So what are these funds? Retirement benefits, including Social Security and disability payments, veteran’s benefits; and other federal retirement and disability payments account for over 34% of these payments. Medicare in another 18%. Food assistance, unemployment insurance payments, student financial aid, and other assistance payments account for another 9%. Another 16% is for grants to state and local governments for a variety of program areas such as health care (half the amount is Medicaid), transportation, education, and housing and research grants. All the SRF and grant monies are in this 16%. Those water programs are barely visible in this picture. Contracts for purchases of goods and services for military and medical equipment account for another 13%, while smallest amount – salaries and wages for federal employees is 10%. Keep in mind that federal employees have dropped from nearly 7 million to 4.4 million since 1967. No federal employment expansion going on there.

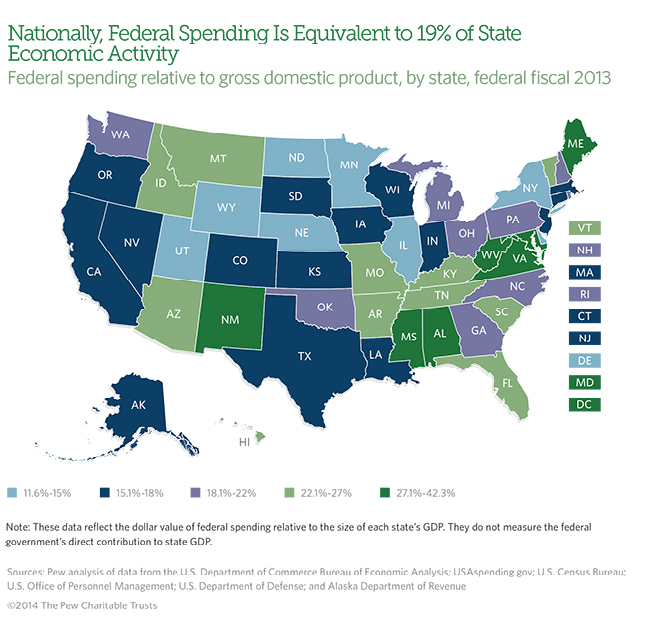
So how much does this affect the states? Federal funds account for about 19 of the total gross domestic product of the US, a number that has been relatively consistent (within a few percentage points) for years. That is below its all-time highs, and about typical over the past 30 years. Figure 1 from a PEW report shows that federal funds are greater than 22% of the GDP in most southern states (which interestingly enough have the people that complain the most about the federal government intrusion), while the Plains states, Midwest, northeast and the west coast are generally below average, and the two coasts, especially complain the least. Mississippi, Virginia and New Mexico all top 30%.
So let me see if I have this right – those that pay the least, but get the most, complain the most about their benefactors, and those that pay the most, but collect less, complain less. That is the message! What is WRONG with that picture? And those people? The problem is I see it every day at the local level and it is truly baffling. It means that somehow our politics gotten so out of whack that those in need the most, seem to continue to vote against their best interests? Marketing clearly is a problem but are we fooled that easily. A message that distracts from the reality is obvious, but this continuing trend is just truly weird. No wonder it is so hard to accomplish things.
