Very cool potential cancer therapy
Leave a comment

A utility’s novel attempt to force farmers to curb pollution in rivers failed. Now the utility is on the hook for millions of dollars to protect the region’s drinking water.
— Read on www.governing.com/topics/transportation-infrastructure/gov-des-moines-water-utility-lawsuit-farmers.html
Voters in red and blue states like them. But historically, transportation “lockboxes” do little to address transportation problems.
— Read on www.governing.com/topics/transportation-infrastructure/gov-connecticut-transportation-lockbox-ballot-states.html
A couple summer’s back we had the Animas River turn yellow because of materials stored on the edge of the river. A couple years before that, coal ash and the Charleston spill. Now the “red” river (but at in Russia)….So maybe legislators can help us understand why continuing to store this stuff on the edge of water supplies is ok? Or why we shouldn’t put a bunch of money toward removing this material so water supplies and ecosystem are less at risk?
http://www.cnn.com/2016/09/12/world/russia-red-river-siberia/?iid=ob_homepage_deskrecommended_pool
The reliability of the assets within the area of interest starts with the design process in the asset management plan. Decision-making dictates how the assets will be maintained and effective means to assure the maximum return on investments. Through condition assessment, the probability of failure can be estimated. Assets can also fail due to a growing area that may contribute to exceeding its maximum capacity. Operation and maintenance of the assets are important in reassuring a longer life span as well as getting the most out of the money to be spent. Prioritizing the assets by a defined system will allow for the community to see what areas are most susceptible to vulnerability/failure, which assets need the most attention due to their condition, and where the critical assets are located in relation to major public areas (hospitals, schools, etc.) with a high population.
So what happens when conditions change? Let’s say sea levels are rising and your land is low. What would the potential costs be to address this? Better yet, what happens if it rains? We looked at one south Florida community and the flood stage for each based on 3 storm events: the 1:10 used by FDOT (Assumes 2.75 inches in 24 hours), the Florida Building Code event that includes a 5 in in one hour event (7 in in 24 hrs), and the 3 day 25 year event (9.5-11 inches).
Of no surprise is that the flooding increases as rainfall increases. Subsequent runs assumed revisions based on sea level rise. The current condition, 1, 2 and 3 ft sea level rise scenarios were run at the 99 percentile groundwater and tidal dates and levels. Tables 2-5 depict the flood stage results for each scenarios. The final task was designed to involve the development of scenarios whereby a toolbox options are utilized to address flooding in the community. Scenarios were to be developed to identify vulnerabilities and cost effectiveness as discussed previously.
The modeling results were then evaluated based of the accompanying infrastructure that is typically associated with same. A summary of the timelines and expected risk reductions were noted in the tables associated with storm and SLR scenarios. This task was to create the costs for the recommended improvements and a schedule for upgrading infrastructure will be developed in conjunction with staff. Two issues arise. First, the community needs to define which event they are planning to address and the timelines as the costs vary form an initial need of $30 million to over $300 million long-term. Figure 1 shows how these costs rise with respect to time. The long-term needs of $5 million per 100 acres matches with a prior effort in Palm Beach County.

Figure 1 Summary of Costs over the 3 ft of potential sea level Rise by 2011, under the 3 storm planning concepts.

“Or is running a local government like s business killing it?”
I had an interesting conversation at a conference recently. The people I was talking to were advanced in their careers and the discussion moved toward the outlook on management in public settings. Once upon a time, most public works and utility managers were civil engineers, but often they were criticized because they were focused on the engineering aspects as opposed to the people aspects of the community. Their focus was public health and making sure things operated correctly. Most did whatever was needed to accomplish that.
This led to schools of public administration, which actually started educating some of those same engineers about management of large public organizations, organizational theory, human resource, accounting and planning I did all that myself at UNC-Chapel Hill. The goal was to understand finances, people, community outreach, the need to engage citizens and as well as public service. The outcomes were providing good service. That however tends to cost a little more than operations although there are opportunities to be a bit entrepreneurial.
So back to the people in the conversation. They noted that sometime in the 1980s or early 1990s the MPAs were being replaced by MBAs as politicians were focusing on operating “like a business.” Looking at the MBAs out there, the comment was that business schools do not focus on service, but profits to shareholders, and the training is to cut unproductive pieces that detract from the bottom line. Hence investments do not get made if the payback is not immediate. Service is not a priority unless it helps the bottom line. In a monopoly (like a local government), there are no other option, so service becomes a lessor priority.
So it brought up an interesting, but unanswerable question for now: has the move to more business trained people in government created some of the ills we see? The discussion included the following questions/observations (summarized here):
Interestingly though was the one business piece that was missing: Marketing the value of the product (which is different than customer service). Marketing water seems foreign to the business manager in the public sector. The question arising there is whether that is a political pressure as opposed to a forgotten part of the education.
I would love to hear some thoughts…
The average is 4% of visible infrastructure is in poor condition. Actually 4-6% depending on the municipality. And this was visible infrastructure, not buried, but there is not particular reason to believe the below ground infrastructure is somehow far worse off. Or better. That 4-6% is infrastructure that needs to be fixed immediately, which means that as system deteriorate, there is catch –up to do. The good news is many of the visible problems were broken meter boxes, damaged valve boxes, broken curbs and broken cleanouts- minor appearing issues, but ones that likely require more ongoing maintenance that a water main. And the appearance may be somewhat symptomatic – people perceive that the system is rundown, unreliable or poorly maintained when they see these problems. It raises a “Tipping Point” type discussion. “Tipping Points” Is a book written by Malcolm Gladwell that I read last year (great book – my wife found it in a book exchange for free in Estes Park last summer). It was along a similar vein of thought as the Freakanomics books – the consequences of certain situations may be less clear than one thinks. The Tipping point that is most relevant is crime in New York in the early 1990s after Bernard Goetz shot several assailants in the subway. The problem was significant and the subways were thought to be among the higher risk areas. The new police chief and Mayor decided that rather that ignore the petty crimes (like many large cities do), they would pursue those vigorously. So fare hopping on the train and the like were challenged immediately. They decided that no graffiti would be visible on the subways and cleaned cars every night to insure this remained the case. Cars with graffiti were immediately removed from service. New subway cars were ordered. Pride and public confidence improved. Crime dropped. The impact of their efforts was that people recognized that criminal behavior would not be tolerated and fairly quickly criminal activity decreased. It was a big success story, but the underlying reasons were less discussed, but easily transferrable to our infrastructure. If we have broken valve boxes, meters, cleanouts, storm drains etc., the same perceptions of a rundown community rise. Rundown communities lead to a loss of public confidence and trust and pride. And none of those help our mission or our efforts to increase infrastructure spending. 4% might not look like much, but it can drastically change the perception of the community. So let’s start to fix those easy things; and document that we did in our asset management programs.

You asked for more figures – so here you go Very cool stuff. All done by students.


Here is an example of getting to a condition assessment with limited data using power point slides. Note that where there are categorical variables (type of pipe for example), these need to be converted to separate yes/no questions as mixing. Categorical and numerical variable do not provide appropriate comparisons = hence the need to alter. Take a look – but the concept is to predict how well this model explains the break history on this distribution system. Call me and we can try it on yours….
Step 1 Create a table of assets (this is a small piece of a much larger table).
| Asset | Dia |
| water main | 2 |
| water main | 2 |
| water main | 2 |
| water main | 2 |
| water main | 4 |
| water main | 6 |
| water main | 6 |
| water main | 6 |
| water main | 6 |
Step 2 Create columns for the variables for which you have data (age, material, soil type, groundwater level, depth, traffic, trees, etc.)
| Asset | breaks in 10 year | Dia | Age | soil | traffic | Trees | depth | pressure | material | Filed estimate of cond.ition |
| water main | 17 | 2 | 45 | 1 | 1 | 2 | 1 | 55 | 4 | 3 |
| water main | 11 | 2 | 45 | 2 | 1 | 2 | 1 | 55 | 4 | 3 |
| water main | 12 | 2 | 45 | 1 | 1 | 2 | 1 | 55 | 4 | 3 |
| water main | 10 | 2 | 45 | 1 | 1 | 2 | 1 | 55 | 4 | 3 |
| water main | 2 | 4 | 50 | 1 | 1 | 2 | 1 | 55 | 1 | 2 |
| water main | 3 | 6 | 60 | 2 | 2 | 2 | 1 | 55 | 1 | 2 |
| water main | 1 | 6 | 60 | 2 | 2 | 2 | 1 | 55 | 1 | 2 |
| water main | 1 | 6 | 60 | 2 | 2 | 2 | 1 | 55 | 1 | 2 |
| water main | 0 | 6 | 20 | 1 | 1 | 2 | 1 | 55 | 3 | 1 |
Step 3 All variables should be numeric. So descriptive variables like pipe material need to be converted to binary form – i.e. create a column for each material and insert a 1 or 0 for “yes” and “no.”
Step 4 Run Linear regression to determine factors associated with each and the amount of influence that each exerts. The result will give you a series of coefficient s:
s:
Step 5 – Use this to predict where your breaks will likely be in the next 5-10 years.
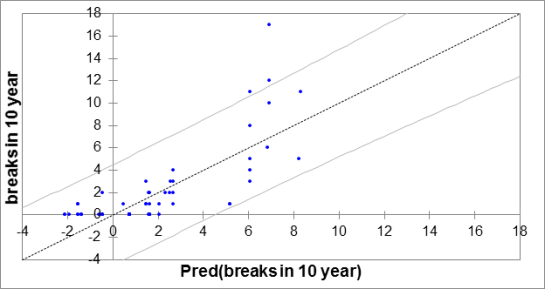
The process is time consuming but provides useful information on the system. It needs to be kept up as things change, but exact data is not really needed. And none of this requires destructive testing. Not bad for having no information.
